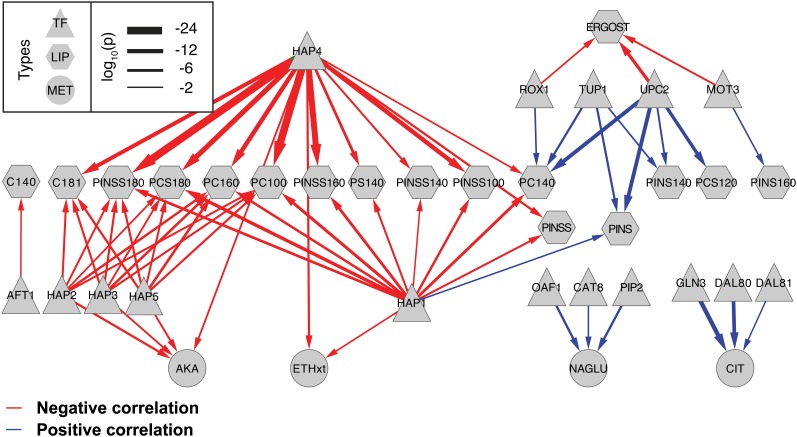
Figure 6.
Transcription factor associations with genes correlated to lipid or metabolite levels. The Fisher exact test was used to identify significant overlaps between transcription factor target sets and genes significantly correlated (blue arrows) or anti-correlated (red arrows) to the implicated lipid or metabolite. The relative thickness of each arrow represents the −log10(P value) from the Fisher exact test.

