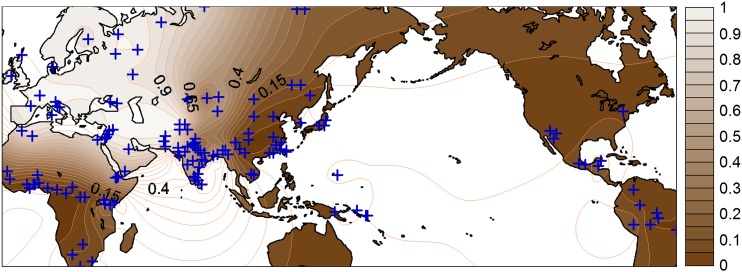
Figure 1.
World distribution of A111T polymorphism in SLC24A5. The origins of sampled populations are indicated (+). Contours of global frequencies of SLC24A5A111T are shaded according to the frequency/color scale to the right. Frequency data by population that were used for this figure are tabulated in Table S1.

