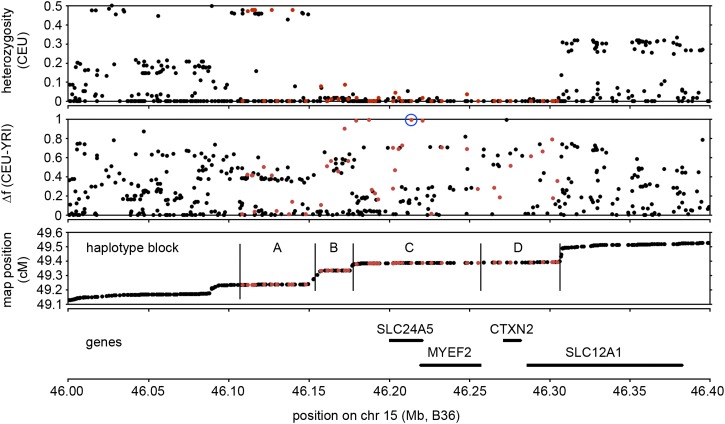
Figure 2.
Genomic region surrounding SLC24A5. The first three panels show SNPs (red symbols, SNPs used for haplotype analysis in HapMap Phase 3, Release 27, also listed in Table S2; black symbols, additional SNPs genotyped in fewer HapMap populations, or flanking SNPs not analyzed here). SNPs monomorphic in the original four HapMap population samples (CEU, CHB, JPT, YRI) are omitted. Top, SNP heterozygosity in CEU, calculated from allele frequencies, illustrating the region of diminished variation in this European sample. Middle, SNP allele frequency difference between CEU and YRI, showing several SNPs with extremely high frequency differentiation (Δf ≥ 0.8); rs1426654 is circled. Beneath is a recombination map showing boundaries of blocks used for haplotype analysis (A through D). Region C, as described in text, is the core region containing SLC24A5. Bottom, positions of SLC24A5 and other genes in region, with common coordinates (NCBI build B36) used for all panels. The centromere is to left.

