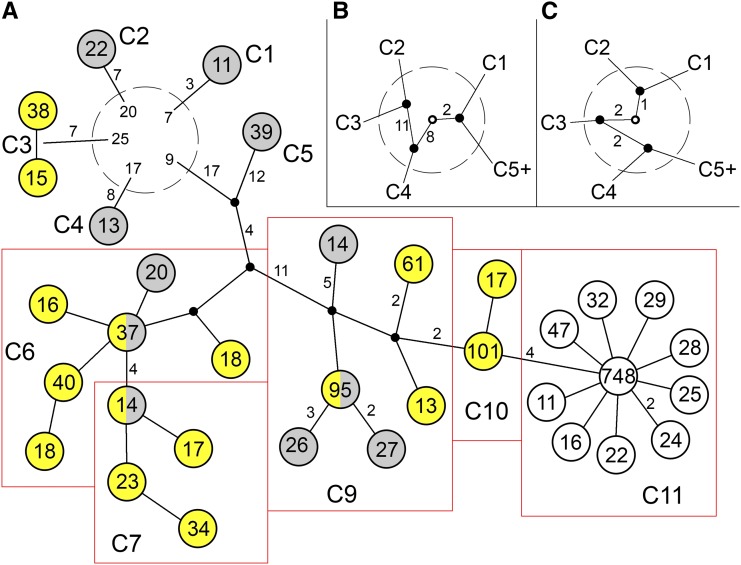
Figure 4.
Phylogenetic relationships among core haplotype clusters. Haplotypes were deduced from 1000 Genomes data by the use of 156 polymorphisms with frequency ≥1%. (A) Haplotypes having frequencies ≥0.5% (representing 78% of total) are depicted. Complete dataset is found in File S1. Sets of haplotypes corresponding to those deduced using 16 SNPs are enclosed within red boxes and labeled C1 through C11. C8, which constituted <0.5%, is not shown. Two variants of C3 differ at an indel that shows evidence of recurrent mutation and for which the ancestral state is unknown. Values within each circle indicate number of occurrences. Gray and yellow shading indicates haplotypes that are predominantly African or East Asian (in this dataset), respectively. Numbers of polymorphic differences on each branch are indicated if greater than one. Inclusion of lower frequency polymorphisms would raise the number of C1-specific variants to 26, whereas C4-specific variants would increase to 11. Early haplotype lineage divergence, depicted within the dashed circle, provides evidence for multiple recombination events that are not resolved in this phylogeny. The numbers within the dashed circle represent number of polymorphic differences from the ancestral state; this involves 31 polymorphisms that have derived alleles shared by more than one lineage. (B) Relationships among early diverging branches supported by 21 polymorphisms. (C) Alternative relationships among early diverging branches supported by 5 polymorphisms. The ancestral state is represented by the open circle in B and C.

