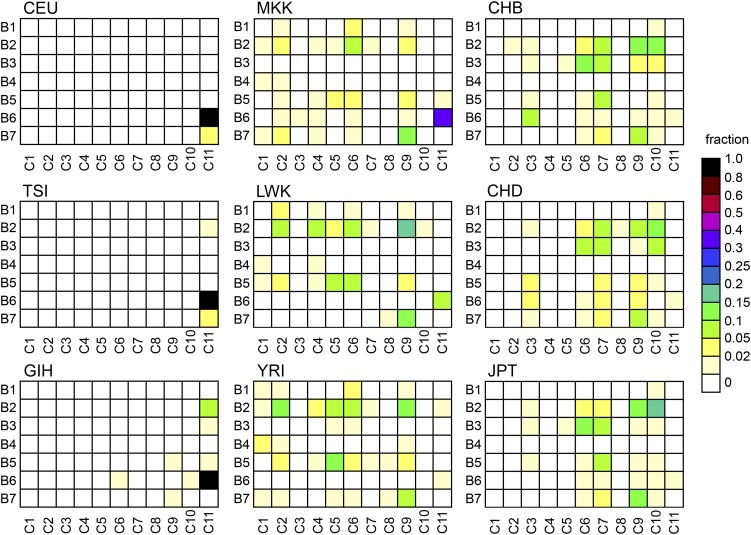
Figure 5.
Relationships between local haplotypes in B and C regions. For each HapMap population, the distribution of haplotype combinations is shown as a heat map (scale on right). Recurrent recombination between core- and B-region is apparent. Predominant association of C11 with B6 contrasts with associations of C10 (B2) and C9 (B2, B7). Counts are shown in File S2.

