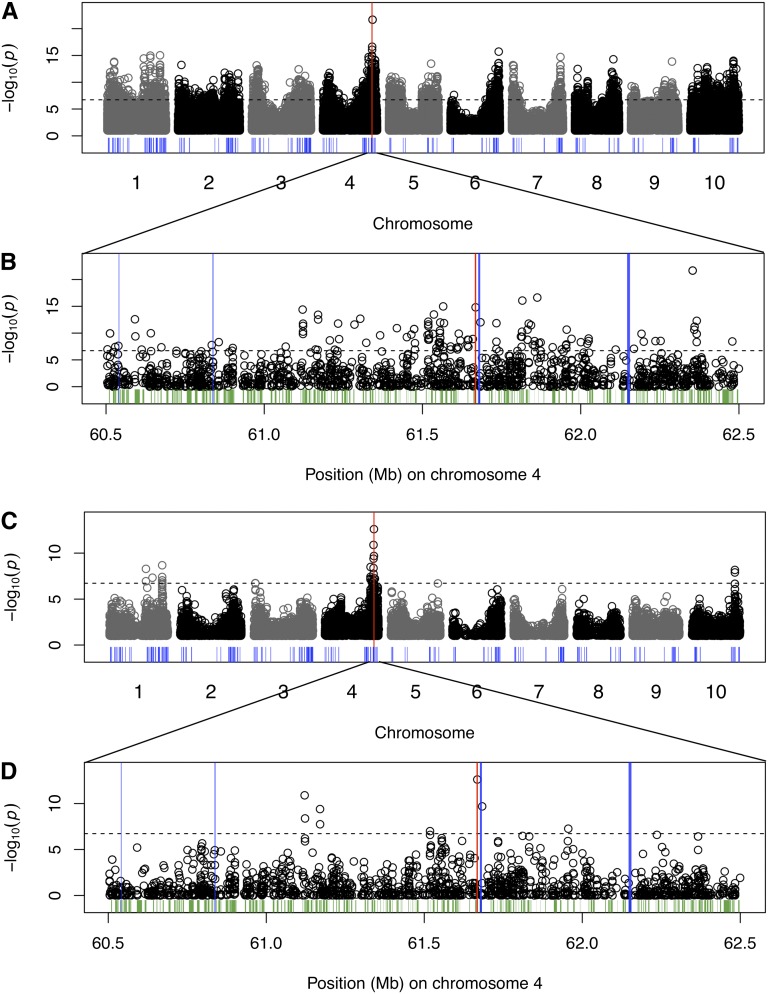
Figure 1.
Genome-wide association study of testa presence using linear models. Manhattan plots using a GLM (A, B) and standard MLM kinship (K) (C, D) with 265,487 SNPs and 336 accessions, with (B, D) detailed view at Tannin1 locus on chromosome 4 for GLM and MLM (K), respectively. Although the Tannin1 locus is identified as the major effect locus for tannin presence with GLM, the Tannin1 gene (red bar) is precisely identified with a MLM. Other flavonoid-related genes are indicated by the blue bars, whereas all other annotated genes in the detailed view are indicated in green.

