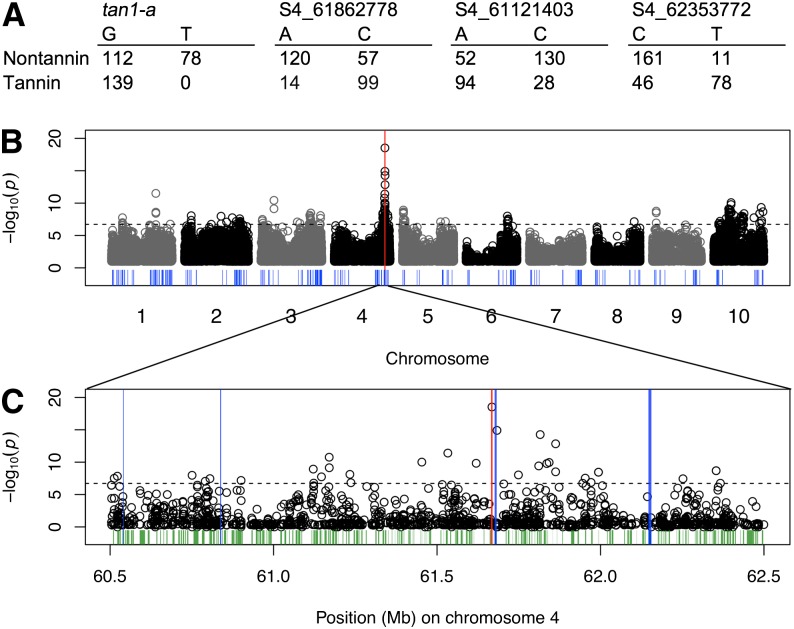
Figure 4.
Genome-wide mapping of testa presence using a loss-of-function genome scan. (A) Allele counts for the tan1-a SNP and other SNPs near Tannin1 that are associated with a nontannin phenotype. The nominal P-value is from a binomial test on the putative loss-of-function allele at each SNP, (B) scanning genome-wide, and (C) a detailed view of the Tannin1 locus on chromosome 4, with Tannin1 indicated by the red bar. Other flavonoid-related genes are indicated by the blue bars, whereas all other annotated genes in the detailed view are indicated in green.

