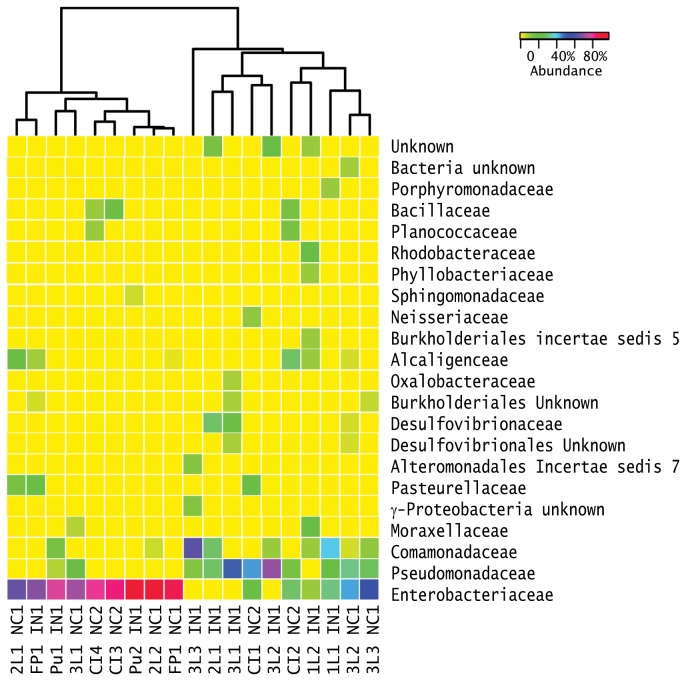
Figure 4. Clustering of samples based on microbiome composition.
The relative proportion of sequences in a specific OTU (color key in upper right corner) is illustrated on a heat map with samples clustered using a furthest neighbor clustering to determine similarity of both the composition and abundance of the microbiomes. Several OTUs were only seen once. Overall, samples did not cluster by population, parental female, life stage, or brood ball age except the cultured isolates (CI3NC1 and CI4NC1) from the digestive system of the 3rd instar larvae. Interestingly, the four cultured samples were oviposited at the same time; however, samples CI3NC1 and CI4NC1 that cluster were sampled 7 d later than CI1NC1 and CI2NC1. Thus, samples CI3NC1 and CI4NC1 were older and were transitioning from the 3rd larval instar to the pupal stages. Each sample is labeled by the source (CI=cultured isolate, 1L=1st instar, 3L=3rd instar, 2L=2nd instar, Pu=pupae, FP= female parent), the isolate or individual animal number, the US state from which the parental female was isolated (NC =North Carolina populations, USA, and IN=Indiana, USA), and the female parent number (NC1, NC2, IN1).

