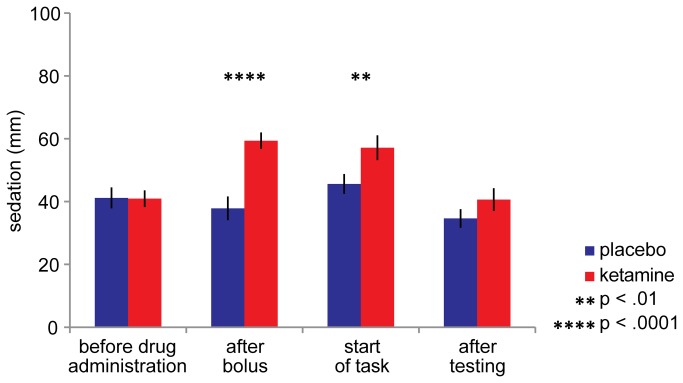
Figure 4. Subjective state of sedation during ketamine and placebo administration.
Sedation level was based on a subset of the visual analogue scales (VAS) [41,45], filled in at different time points of the experiment. It is quantified as the distance (in mm) from a mark placed by the subject on each scale (a 100 mm line connecting two opposite states of mind), measured from the left end of the scale (see ‘Methods’ for details). Sedation levels differed between drug conditions after bolus administration (t(1,15) = -5.563, p = .00005) and at the start of the task (t(1,15) = -2.957, p = .0098). Sedation levels did not differ before drug administration (t(1,15) = .083, p = .94), but after testing subjects in the ketamine condition were still feeling slightly more sedated compared to the placebo condition (t(1,15) = -2.087, p = .054, at trend level). Within-condition, sedation levels after bolus administration and at the start of the task differed from before drug administration for the ketamine (all t(1,15)> 5.6, all p < .0005) but not for the placebo condition (within-condition p-values not depicted in this figure).

