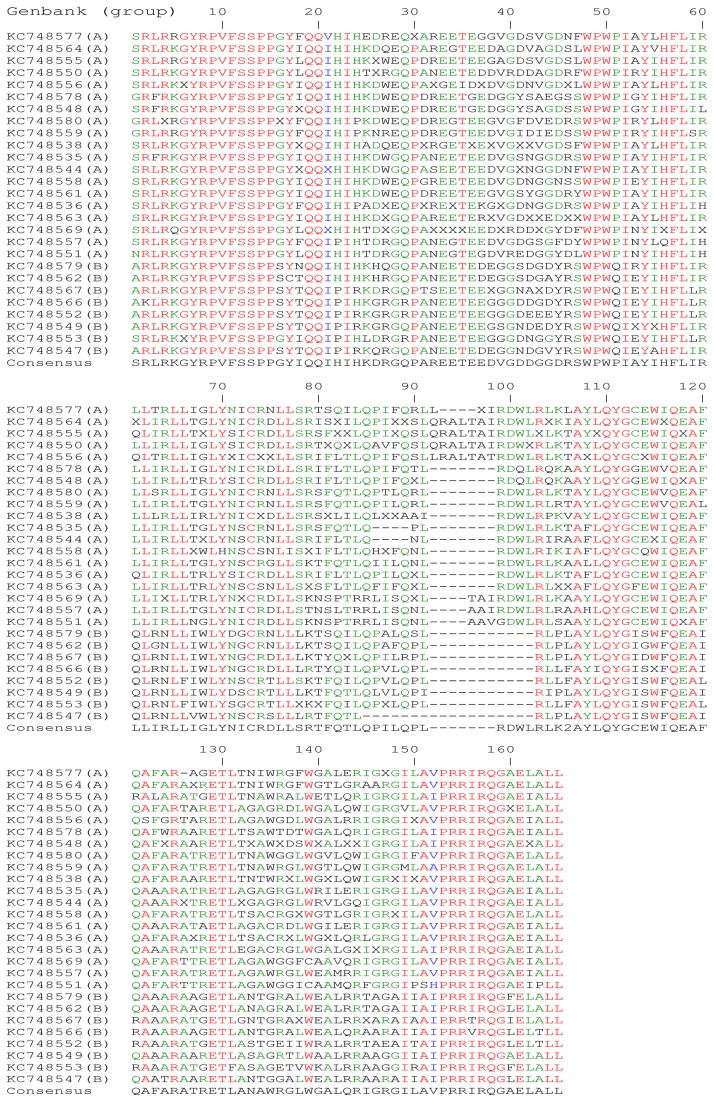
Figure 1. Alignment of 27 virus/provirus CT HIV-2 aa sequences (1 sequence per patient), classified by similarity.
The GenBank accession number is followed by the HIV-2 group (A or B). To construct the alignment, only the most recent sample was included. The conserved aa are highlighted in red (>85% of conservation). In green appears the most represented aa for each position (>50% of conservation). Blue corresponds to variable positions with similar aa.

