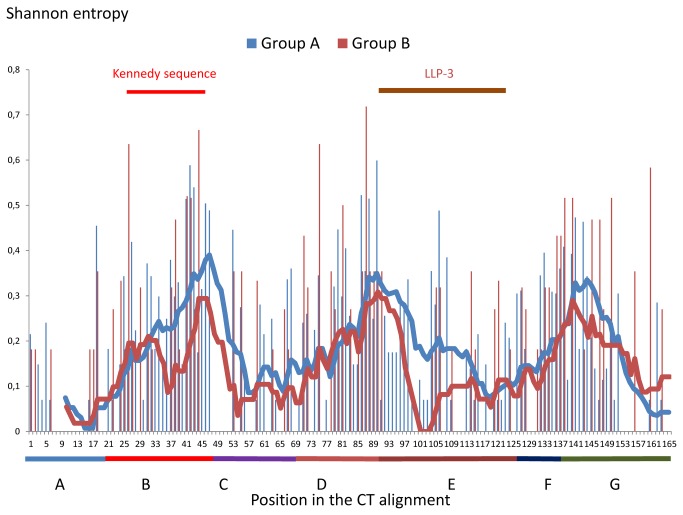
Figure 5. Normalised SE plot of the CT by HIV-2 group.
19 sequences from group A and 8 from group B are included. By contrast to the Figure 2, the SE are normalized by the natural log of the number of sequences to remove the entropy factor due to the sequences number. The lines represent the moving average of 10 positions (blue: group A, red: group B). The colours and letters below the plot represent the different studied regions: A: The first conserved region containing the endocytosis signal, B: The region containing the Kennedy-like sequences, C: The hydrophobic region, D: LLP-2 region, E: LLP-3 region, F: LLP-3 / LLP-1 inter-region, G: LLP-1 region + position 166 for the stop codon.

