Fig. 1.

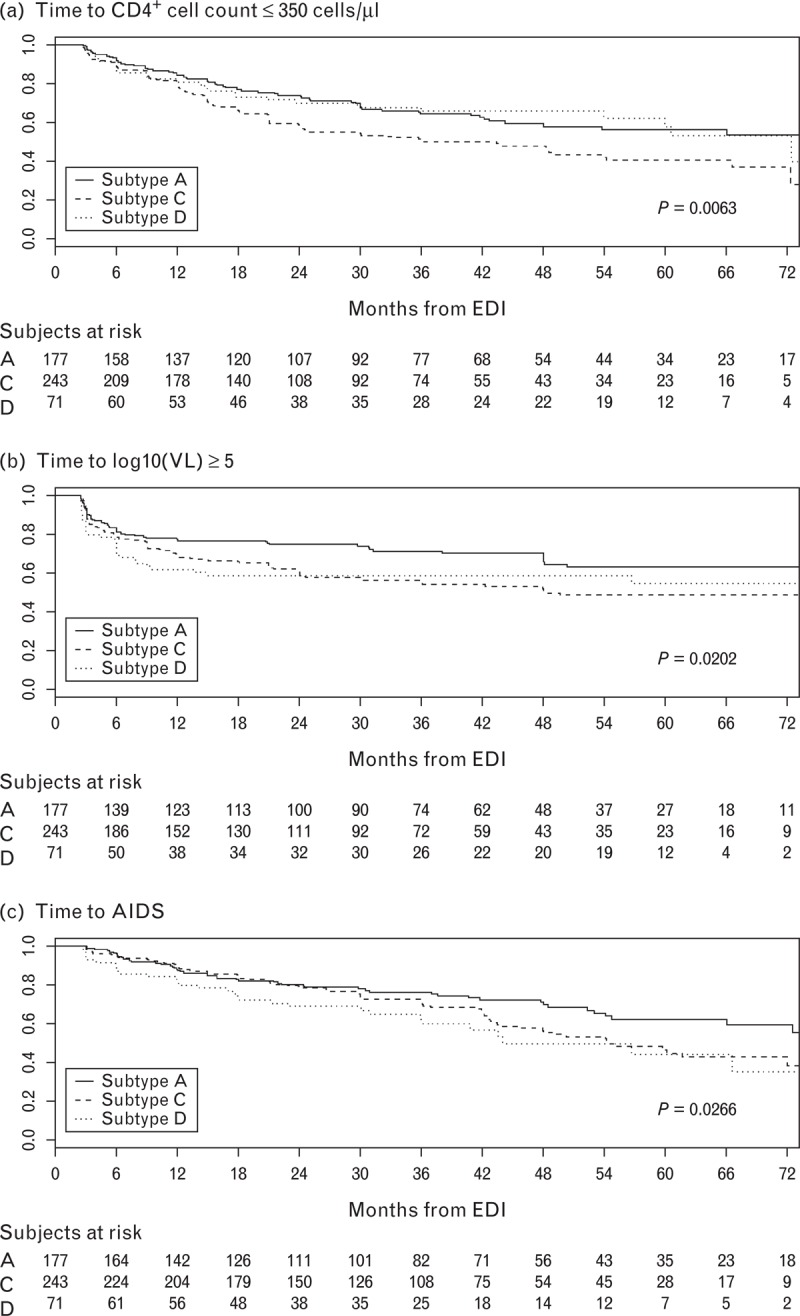
Kaplan–Meier survival curves. (a) Time to CD4+ cell count ≤ 350 cells/μl, (b) time to viral load (VL) ≥105 copies/ml, and (c) time to AIDS by HIV-infecting subtype among participants with human leukocyte antigen (HLA) data (n = 491).

Kaplan–Meier survival curves. (a) Time to CD4+ cell count ≤ 350 cells/μl, (b) time to viral load (VL) ≥105 copies/ml, and (c) time to AIDS by HIV-infecting subtype among participants with human leukocyte antigen (HLA) data (n = 491).