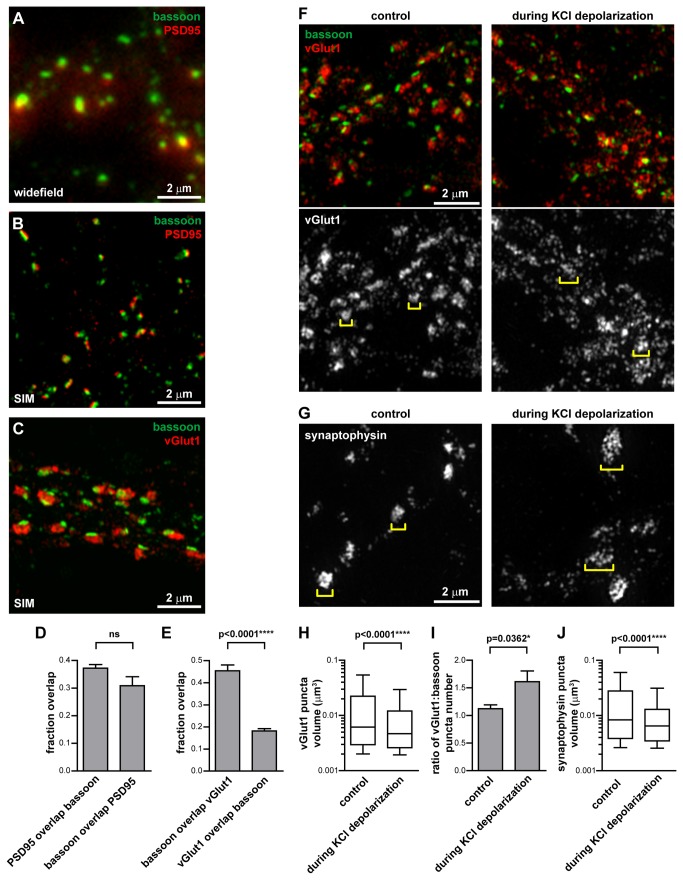
Figure 1. Structured illumination microscopy can resolve different synaptic domains.
(A,B) 17-20 DIV hippocampal neurons immunostained for the active zone protein bassoon and the post-synaptic density protein PSD95, or (C) bassoon and the synaptic vesicle protein vGlut1. (A) Imaged with widefield fluorescence microscopy, bassoon and PSD95 puncta overlap. (B) Imaged with SIM, the increased resolution shows that bassoon and PSD95 occupy separate domains, consistent with their function in the pre- and post-synaptic compartments respectively. (C) Within the presynaptic bouton, the synaptic vesicle pool (represented by vGlut1) and the active zone (represented by bassoon) can be distinguished with SIM. (D) Manders’ coefficient measurement of the proportion of PSD95 signal which overlaps with the bassoon signal and vice versa. Unpaired t-test, 6 fields of view. (E) Manders’ coefficient measurement of the proportion of bassoon signal which overlaps with the vGlut1 signal and vice versa. Unpaired t-test, 6 fields of view. Graphs represent the mean ± s.e.m. (F,G) During depolarization of neurons with 50 mM KCl, the synaptic vesicle markers vGlut1 and synaptophysin become smaller and more numerous, and spread over larger area (brackets). (H) The vGlut1 puncta volume decreases during KCl depolarization. Box and whiskers graph. Mann Whitney test, 7 fields of view, ≥980 vGlut1 puncta analyzed per condition. (I) The number of vGlut1 puncta per bassoon puncta increases during KCl depolarization. Graph represents the mean ± s.e.m. Unpaired t-test, 7 fields of view, ≥874 bassoon puncta analyzed per condition. (J) The synaptophysin puncta volume decreases during KCl depolarization. Box and whiskers graph. Mann Whitney test, ≥10 fields of view per condition, ≥533 synaptophysin puncta analyzed per condition.

