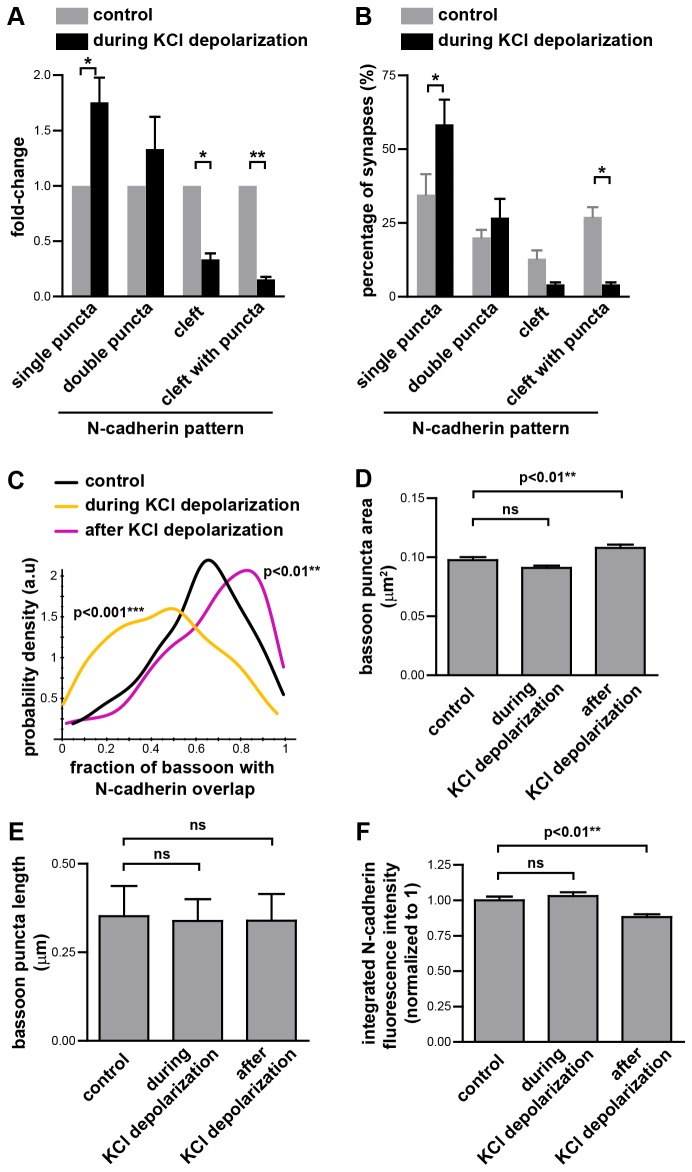
Figure 3. N-cadherin localization changes during and after KCl depolarization.
(A,B) During depolarization with 30-50 mM KCl, the proportion of synapses with N-cadherin puncta adjacent to the active zone increases, whereas the proportion of synapses with N-cadherin along the synaptic cleft decreases. n=3 experiments, ≥88 synapses per experiment, total of 315 synapses (178 and 137 synapses for the control and during KCl stimulation conditions respectively). * = p<0.05, ** = p<0.01, two-way ANOVA with matched values and Bonferroni post-test. Graphs represent the mean ± s.e.m. (C) Colocalization of N-cadherin with bassoon was measured by the fraction of each bassoon puncta that overlapped with N-cadherin. The probability density function for the distribution of the values for the fraction of each bassoon puncta which overlaps with N-cadherin shows that during KCl depolarization less N-cadherin colocalizes with bassoon, whereas 15 min after transient exposure to KCl, more N-cadherin colocalizes with bassoon. Kruskal-Wallis test, Dunn’s post-test. n=3 experiments, ≥212 synapses per experiment. (D) The area (mean ± s.e.m) of each bassoon puncta during and 15 min after transient KCl depolarization. One-way ANOVA, Dunnett’s post-test. n=3 experiments, n≥220 synapses per experiment, 1133 synapses total. (E) The length of each bassoon puncta during and 15 min after transient KCl depolarization. Graph represents the median and interquartile range. Kruskal-Wallis test, p =0.1213. n=3 experiments, n≥314 synapses per experiment, 1054 synapses total. (F) The integrated N-cadherin fluorescence intensity of N-cadherin at each synapse was measured and normalized to the mean value of the control synapses in their respective experiment. Graph represents the mean ± s.e.m. One-way ANOVA, Dunnett’s post-test. n=3 experiments, n≥214 synapses per experiment, 1037 synapses total.

