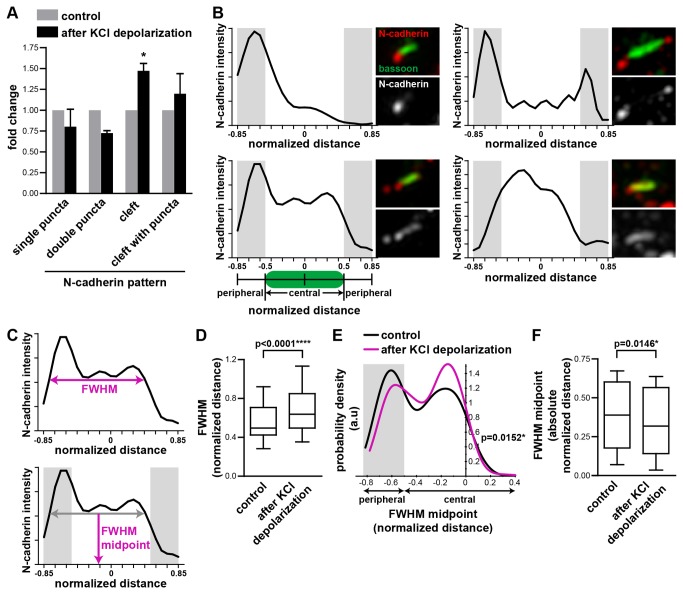
Figure 4. Transient synaptic stimulation relocalizes N-cadherin from the periphery to the center of the synapse.
(A) Transient KCl depolarization followed by a rest of 15 min reduced the proportion of synapses with punctate N-cadherin adjacent to the active zone and increased the proportion of synapses with N-cadherin along the synaptic cleft. n=3 experiments, ≥120 synapses per experiment. * = p<0.05, two-way ANOVA. (B) Example linescans of N-cadherin fluorescence intensity along the synaptic cleft. Corresponding images are on the right of each linescan. Linescans extended beyond both ends of the active zone as delineated by the bassoon rods, and were normalised to the length of the bassoon rods. The central region was defined as the region occupied by bassoon. The peripheral region was immediately adjacent to this (shaded in gray). (C) Definition of the full-width at half-maximum (FWHM) and FWHM midpoint. (D) Box and whiskers graph of the FWHM distribution. Transient KCl depolarization increased the FWHM of the N-cadherin fluorescence peak. n≥339 synapses per condition. Mann Whitney test. (E) The probability density function for the distribution of the FWHM midpoint values. Transient KCl depolarization shifted the FWHM midpoint of the N-cadherin fluorescence peak from a peripheral to a central synaptic location. n≥339 synapses per condition. Mann Whitney test. (F) Box and whiskers graph of the absolute value of the FWHM midpoint. After transient KCl depolarization, the absolute FWHM midpoint decreased, indicating a shift towards the center of the synapse. n=3 experiments, n≥214 synapses per experiment. Mann Whitney test.

