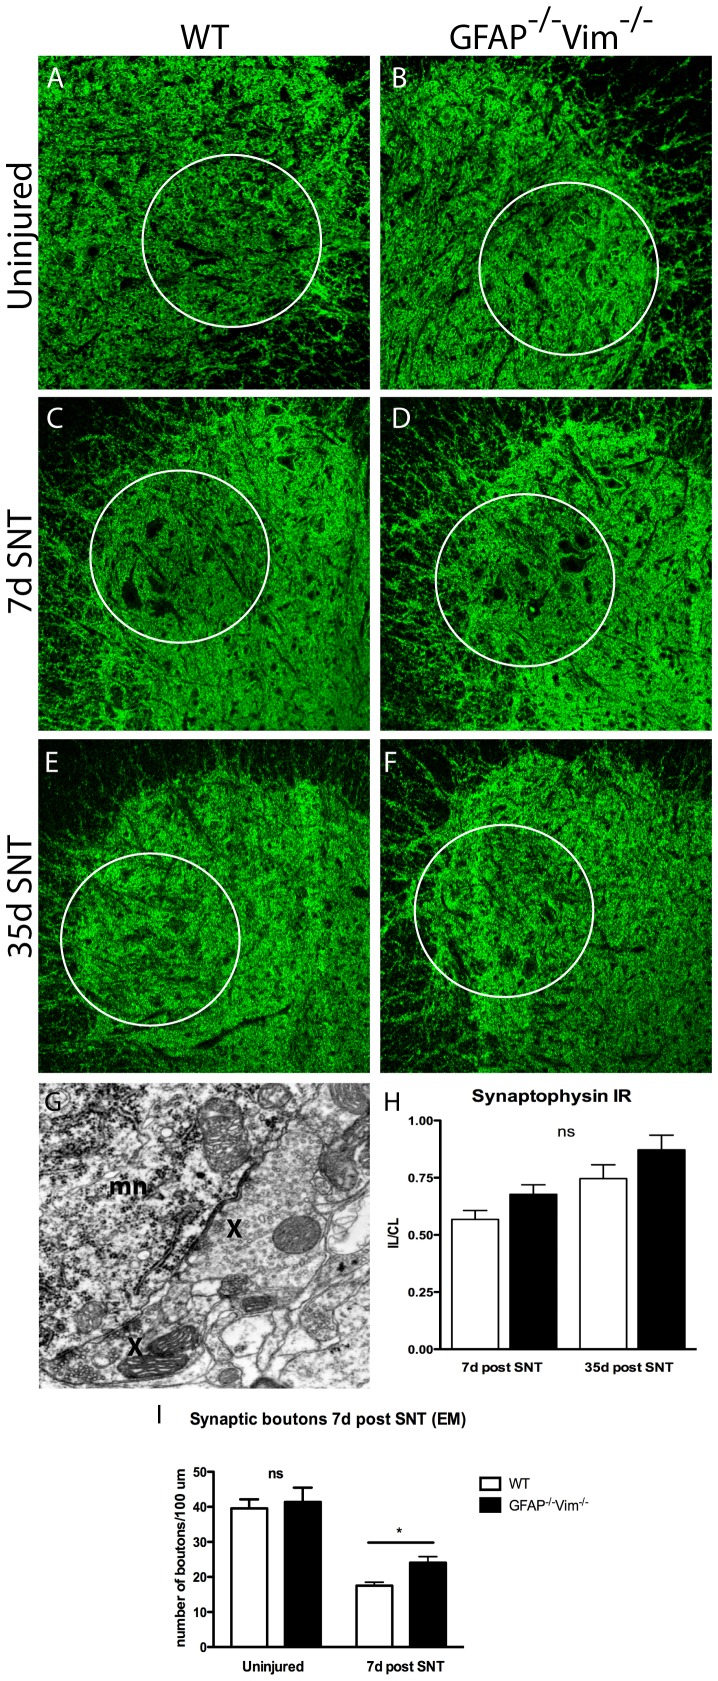
Figure 3. Synaptic stripping in the spinal cord 7 and 35 days after SNT.
Synaptophysin IR in the ventral horn harbouring the sciatic motor pool (A-F) displayed a similar pattern in uninjured WT (n = 6) and GFAP–/–Vim–/– (n = 6) mice (A, B). At 7 days after SNT there was a clear decrease in synaptophysin IR in both WT (n = 6) and GFAP–/–Vim–/– (n = 6) mice on the ipsilateral side (C, D) compared to the contralateral side (not shown). At 35 days after SNT, synaptophysin IR had increased compared to 7 days after SNT (E, F), but no significant difference between the strains were seen at any of the two time points (H). A representative electron microscopic picture shows a motoneuron (mn) and two apposing synaptic terminals (x), (G). Seven days after SNT, electron microscopy revealed fewer boutons/100 µm of soma membrane length on the injured motoneurons in WT (n = 3) compared to GFAP–/–Vim–/– (n = 3) mice (I). Error bars indicate SEM. * p<0.05, ns = non-significant. Scale bar, 200 µm.

