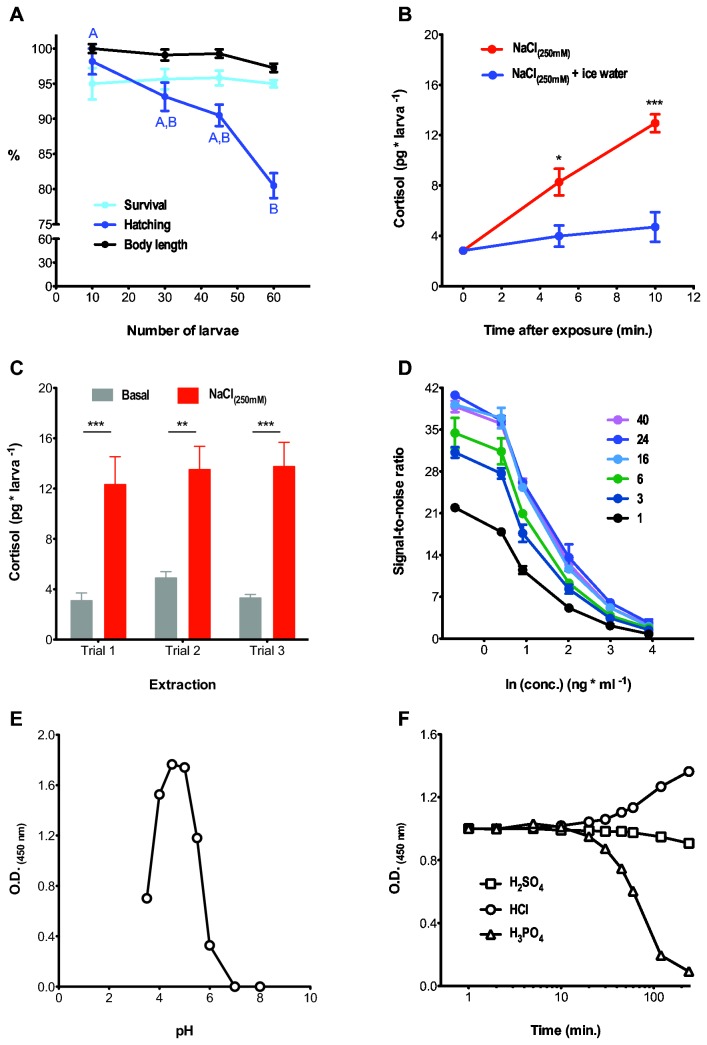
Figure 1. Optimization of sample collection, extraction and ELISA protocols to measure cortisol level in zebrafish larvae.
(A) The relationship between the number of larvae per raising well and survival (light blue circles, in %; Kruskal-Wallis test, H=1.0, p = 0.80, N = 6), hatching (dark blue circles, in %; Kruskal-Wallis test, H=15.6, p < 0.01, N = 6; uppercase letters depict differences between groups, Dunn's multiple comparison test for pair comparisons,) and body length (black circles, in %; Kruskal-Wallis test, H=8.3, p = 0.04, N = 15; no pair differences detected by Dunn's multiple comparison test for pair comparisons) at 2 dpf evening. (B) Exposure to NaCl (red circles) increases whole-body cortisol in 5 dpf larvae. Submerging the larvae in ice-cold water immediately after NaCl exposure (blue circles) efficiently prevents the raise of cortisol caused by the osmotic shock (red vs. blue circles, Kruskal-Wallis test, osmotic shock–red circles: H=17.1, p < 0.001, osmotic shock followed by ice-cold water incubation–blue circles: H=1.5, p = 0.47). For each exposure time, asterisks designate statistical differences between pairs, *p < 0.05, ***p < 0.001 (Two sample t-tests, non-exposed: t(12) = 0.0, p = 1.0, 5 min.: t(11) = 3.1, p = 0.01, 10 min.: t(12) = 6.0, p < 0.0001). (C) Cortisol level in NaCl-exposed and non-exposed larvae remain the same across experiments and independent extractions (Two way ANOVA, treatment: F(1,18) = 62.9, p < 0.001; extraction: F(1,18) = 0.53, p = 0.60; treatment x extraction: F(1,18) = 0.20, p = 0.82; Bonferroni’s post-tests, **p < 0.01 and ***p < 0.001 for comparisons of pairs across extractions). (D) Signal-to-noise ratios from different cortisol concentrations (0.1-50 ng cortisol ml-1) in wells coated with cortisol mAB for 1-40 hours (sample size per group = 2). (E) An incubation of HRP with TMB at a pH level of 4.5 gives the highest signal intensity, whereas signal detection decreases sharply at pH levels lower and higher than 3.5 and 6, respectively. (F) Time course of signal intensity after applying different 1 M stop solutions. Among them, H2SO4 preserves signal stability overtime.

