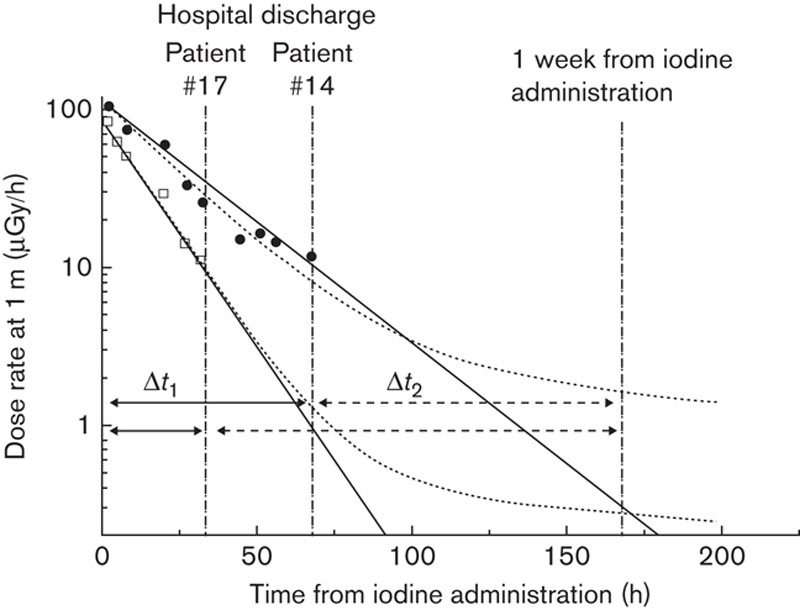
Fig. 1.

Examples of the measurement setup for patients 14 (slower kinetics) and 17 (faster kinetics) who stayed 68 and 33 h in the hospital after iodine administration. The measured dose rates at 1-m distance (in logarithmic scale) during the hospital stay are presented with solid circles (#14) and open squares (#17) with two different model fits, monoexponential (solid line) and biexponential (dotted curve). The first thermoluminescence dosimetry holder was used during the hospital stay (solid arrow, Δt1) and the second holder was used after the hospital discharge up to 1 week from the administration of radioiodine (dashed arrow, Δt2). The parameters of the biexponential model are #14: k=0.013, T1=16.7 h (monoexponential: 17.1 h), and #17: k=0.006, T1=10.4 h (monexponential: 10.5 h).
