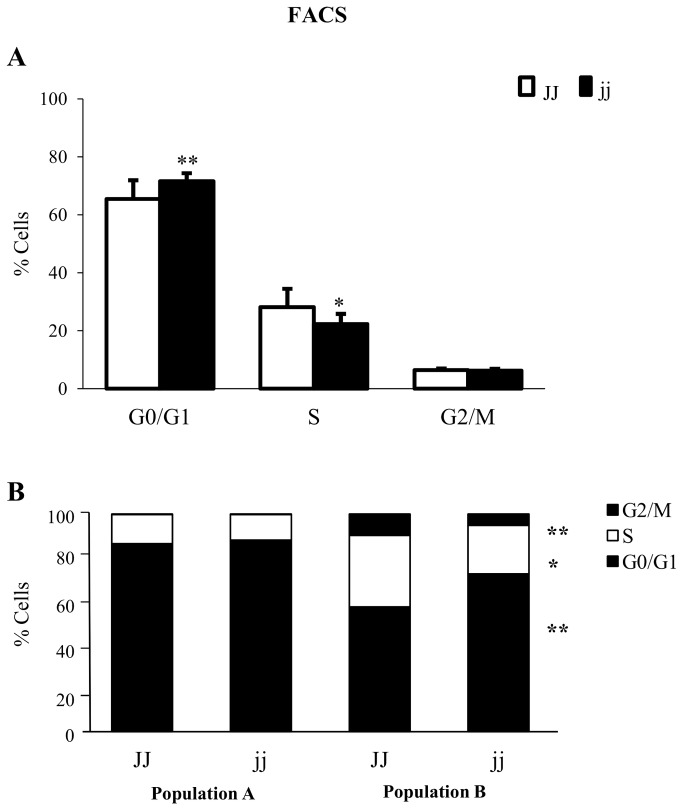
Figure 5. Cell Cycle profile in JJ and jj P9 Gunn rats.
Cell cycle was analysed on cells from whole cerebella (A), and in population A and B, identified by forward- scattering (B). □ Normal homozygous JJ and ■ Hyperbilirubinemic homozygous jj Gunn rat. Data are expressed as mean ± SD. Statistical significance: * p < 0.05, ** p < 0.01.

