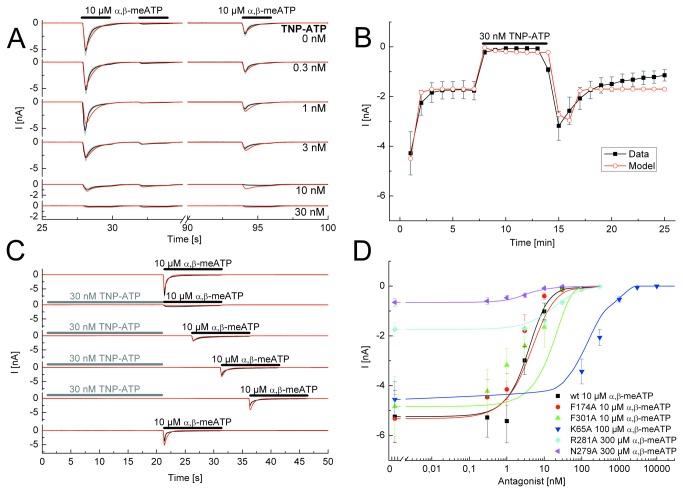
Figure 2. Application protocols used to investigate the nature of antagonism between TNP-ATP and α,β-meATP at the wild-type (wt) P2X3R and its binding site mutants.
A, Steady-state application protocol for the wt P2X3R. α,β-meATP (10 µM) was superfused three times for 2 s each, with 2-s and 60-s intervals between subsequent applications, both in the absence and in the presence of increasing concentrations of TNP-ATP (0.3-30 nM; each agonist application cycle was spaced apart by 5 min). B, Dynamic antagonist application protocol. α,β-meATP (10 µM) was repetitively applied for 1 s each at an interval of 1 min. The onset and offset of the blockade by TNP-ATP (30 nM; 5 min) is shown. C, Wash-out protocol for the wt P2X3R. α,β-meATP (10 µM) application of 10-s duration was done either in the absence of TNP-ATP (30 nM) or at variable time-periods (up to 15 s, as indicated) after its wash-out; TNP-ATP was superfused for 25 s with 5 min intervals between each run. D, Concentration response-curves for the indicated mutant receptors simulated by the Markov model (lines) to fit the experimentally determined mean current amplitudes (symbols) without and with increasing concentrations of TNP-ATP (0.3 nM - 10 µM) in the superfusion medium. The F301A curve is misplaced with respect to the symbols. One possible explanation for this finding is that the simulation takes the kinetics, the association and dissociation rates and the recovery time into account and not only the amplitudes. α,β-meATP concentrations were adjusted for the requirements of every mutant. The black lines represent the experimentally measured P2X3R currents (A, C) or the lines connecting the experimentally determined mean values (B), with the grey bars as their S.E.M. The fitted currents have a red colour. Means ± S.E.M. of the data together with the generated concentration-response curves are shown in colour (D). The number of similar experiments for each group of data varied from 6-13. The thick horizontal lines above the current traces designate the duration of agonist or antagonist superfusion.

