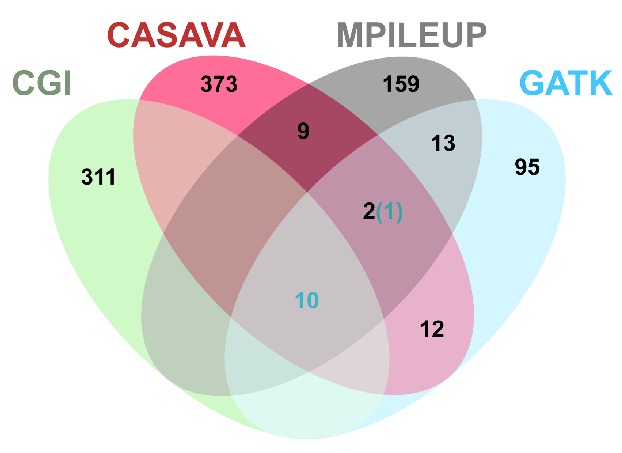
Figure 1.

Four-property Venn Diagram of candidate somatic variants within exons and splice sites called by different analysis approaches. Venn Diagram illustrating the number of true (blue numbers) and false (black numbers) somatic variant calls within the coding regions, untranslated regions, and invariant two bases of the donor or acceptor splice sites that were unique to or shared among the various analysis approaches. Data are provided for four analysis approaches described in the Methods: GATK, MPileup, and CASAVA for the Illumina data and Complete Genomics analysis pipeline for the Complete Genomics data. Four-property Venn Diagram created by Gliffy Online (www.gliffy.com).
