
Figure 2.
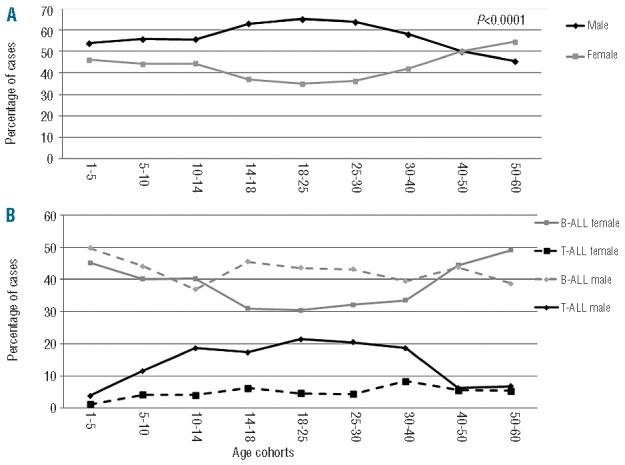
Gender distribution. (A) Gender distribution analysis among age cohorts. The analysis reveals a decreased incidence of females between 14 and 50 years. The gray line represents females, the black line males. (B) Gender distribution and lineage derivation among different age groups. The gray continuous line represents B-ALL females, the gray dotted line B-ALL males, the black continuous line T-ALL males and the black dotted line T-ALL females.