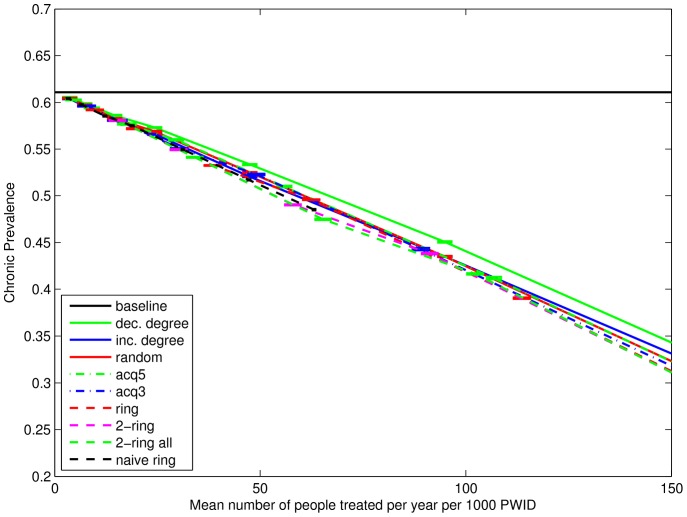
Figure 8. Chronic prevalence at week 156.
Vertical coordinate shows the mean chronic prevalence (defined as the proportion of nodes infected constantly for the last 26 weeks, calculated as the mean proportions across 500 simulations and then the mean (with 95% confidence interval) across 100 networks. Horizontal coordinate shows the mean number of treatments started in weeks 1–156, calculated as the means across 500 simulations per network, then the mean across 100 networks, and then the mean across 3 years.

