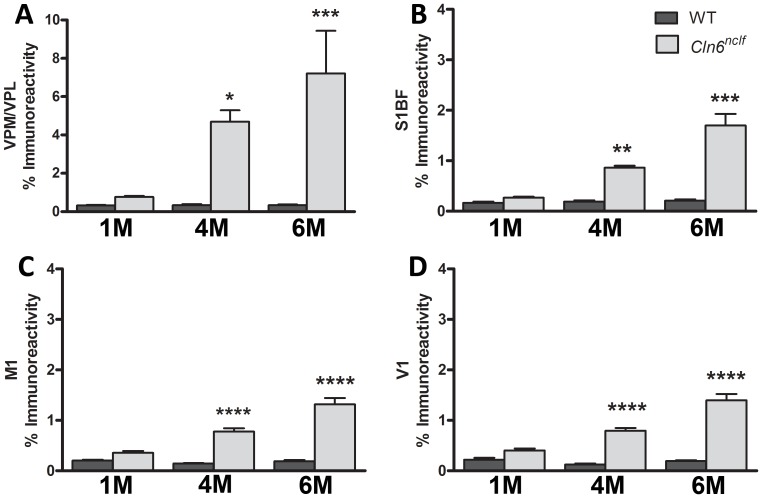
Figure 8. Upregulation of microglial marker CD68 in the thalamus and cerebral cortex of Cln6nclf mice.
Quantitative thresholding analysis in Cln6nclf mice was compared to age matched WT, revealing a significant increase in the expression of the microglia marker CD68 in the VPM/VPL (A), M1 (C), S1BF (B), and V1 (D) regions in the Cln6nclf mouse over WT. [Mean% immunoreactivity +/− SEM, n = 3 (*p≤0.05, **p≤0.01, ***p≤0.001, ****p≤0.0001)].

