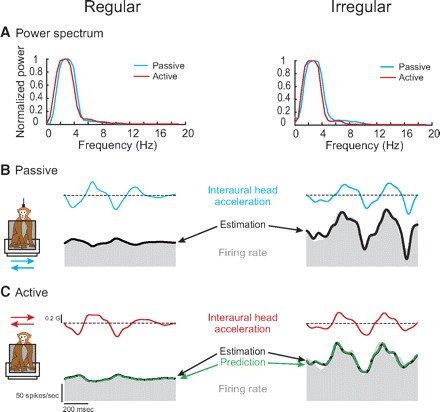
FIG. 2.

Activities of an example regular (left; CV* = 0.04) and irregular (right; CV* = 0.24) otolith afferent during passive and active interaural translations with comparable acceleration profiles. A: power spectra of head acceleration during passive (blue) and comparable active (red) translations. Both movements had similar power for the range of frequencies of 0–10 Hz. B: response of afferents to passive translations. Superimposed on the firing rate (shaded trace) is the model fit (black trace) based on the bias discharge, the acceleration sensitivity, and jerk sensitivity. C: response of afferents to active translations. The estimated response (black trace) based on the bias discharge, acceleration sensitivity, and jerk sensitivity is superimposed on the firing rate. To obtain the prediction fit (dashed green trace), the bias and the sensitivity values of the passive model were applied. The variance-accounted-for (VAF) of the estimation and prediction were similar.
