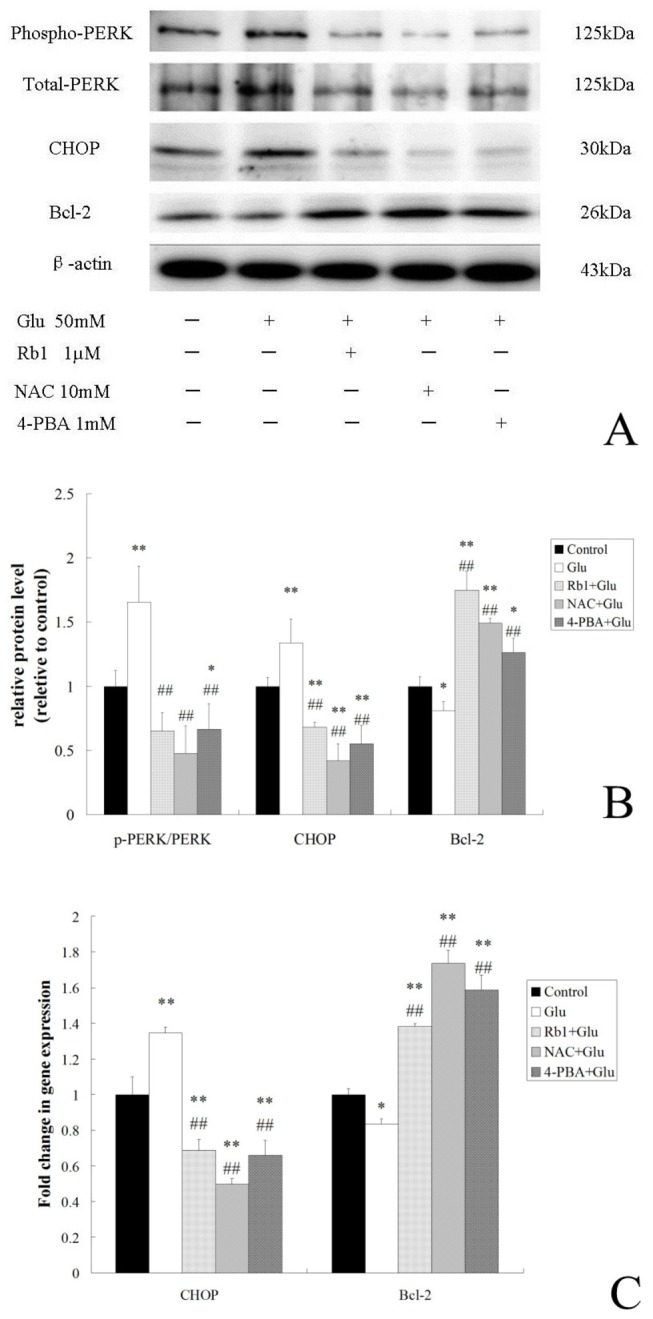
Figure 3. Effects of ginsenoside Rb1 on ER stress-mediated apoptotic signaling pathways in high glucose-treated hippocampal neurons.

(A) Immunoreactive bands of p-PERK, PERK, CHOP, Bcl-2 and actin using specific antibody. (B) Quantitative analysis of relative protein level. Results are expressed as the means ± SD from 3 independent experiments.β-actin was used as the loading controls. (C)Histogram indicating the fold changes in mRNA levels by real-time PCR compared to the respective control after normalization to GAPDH. The results represent the mean ± S.D of three independent experiments. *P<0.05, as compared to the control group; **P<0.01, as compared to the control group; ##P<0.01, as compared to the high glucose group.
