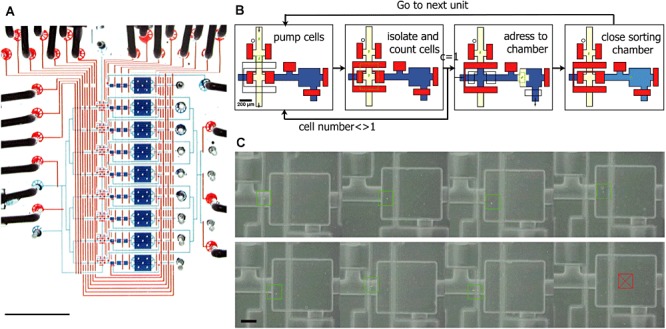
Figure 1.

Photograph of a single‐cell isolation and genome amplification chip capable of processing nine samples in parallel (eight cells, one positive control). A. To visualize the architecture, the channels and chambers have been filled with blue food colouring and the control lines to actuate the valves have been filled with red food colouring (scale bar 5 mm). B. Schematic diagram of the automated sorting procedure. Closed valves are shown in red, open valves are transparent. Cells are drawn in green. C. Typical result of cell sorting showing for each unit (seven with a single cell and one negative control without a cell) a colour combination of a phase contrast image (gray) and a fluorescence image (green). A green overlaid square has been placed around the cell to ease visualization, whereas a red crossed square indicates the absence of cell. Scale bar is 100 µm. Reprinted from Marcy et al. (2007a).
