
Figure 4.
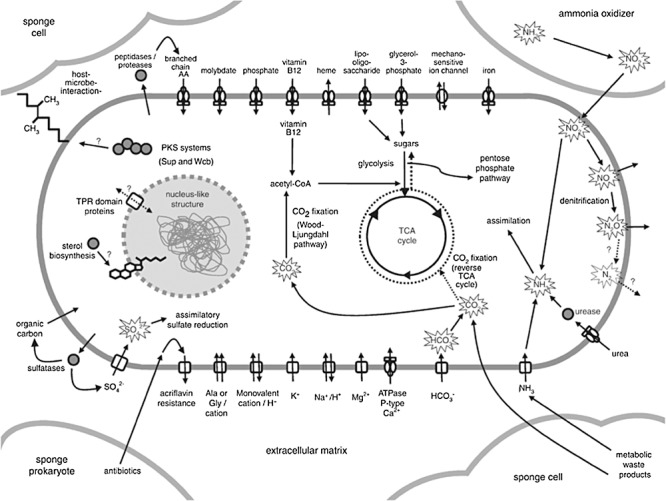
A schematic overview of poribacterial metabolism as deduced from SAG sequencing. Reprinted by permission from Macmillan Publishers Ltd: The ISME Journal (Siegl et al., 2011), copyright 2011.
Official websites use .gov
A
.gov website belongs to an official
government organization in the United States.
Secure .gov websites use HTTPS
A lock (
) or https:// means you've safely
connected to the .gov website. Share sensitive
information only on official, secure websites.
A schematic overview of poribacterial metabolism as deduced from SAG sequencing. Reprinted by permission from Macmillan Publishers Ltd: The ISME Journal (Siegl et al., 2011), copyright 2011.