
Figure 2.
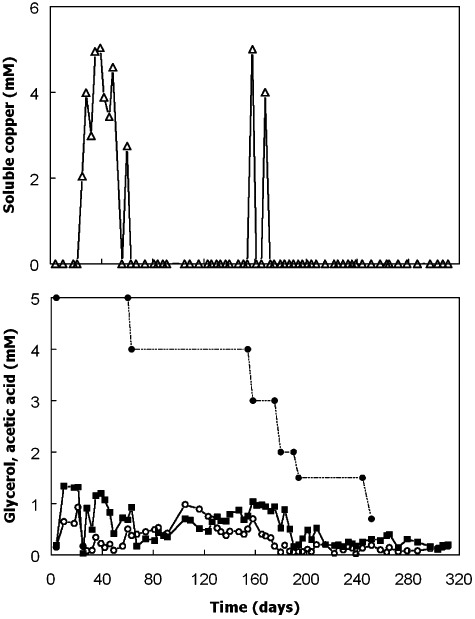
Changes in concentrations of soluble copper (▵), glycerol (○) and acetic acid ( ) in bioreactor I during the first phase of operation. Concentrations of glycerol in the feed liquor are also shown (●). The feed liquor contained 1 mM copper, zinc and ferrous iron and its pH was progressively lowered from 2.5 to 2.1 on day 21.