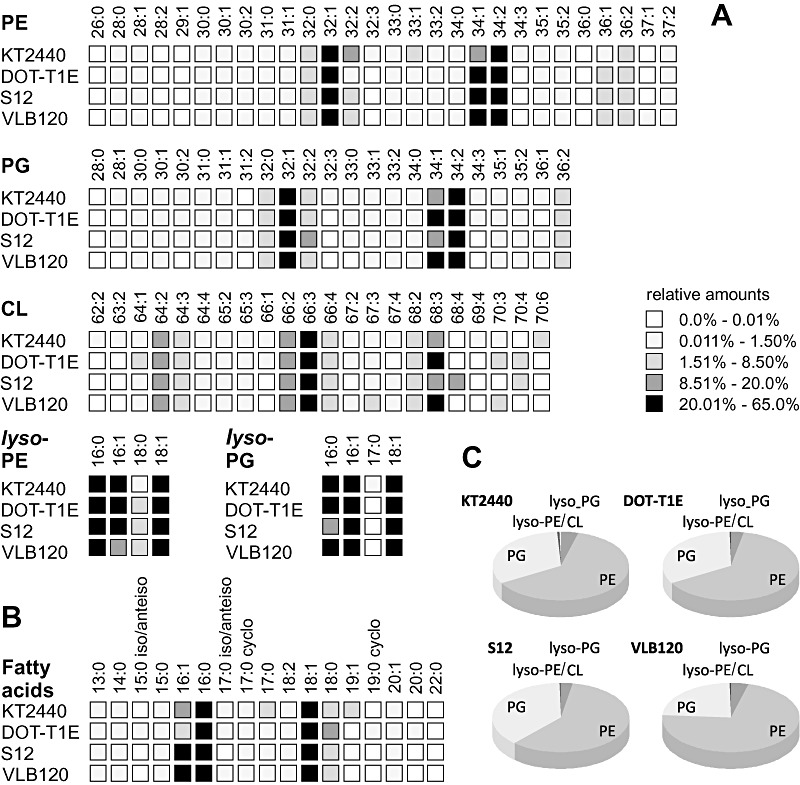
Figure 3.

Comparative analysis of the glycerophospholipid inventory of four pseudomonads, P. putida KT2440, DOT‐T1E, S12 and Pseudomonas sp. strain VLB120. Analysis refers to: (A) the relative amounts of phosphatidylethanolamine (PE), phosphatidylglycerol (PG), cardiolipin (CL) and respective lyso‐species; (B) detectable fatty acid moieties within all glycerophospholipid species; (C) the relative distribution of the glycerophospholipid classes. Percentage values are calculated from the ratio of the peak area of a glycerophospholipid (LC/MS) or fatty acid species (GC/MS) to the respective overall areas.
