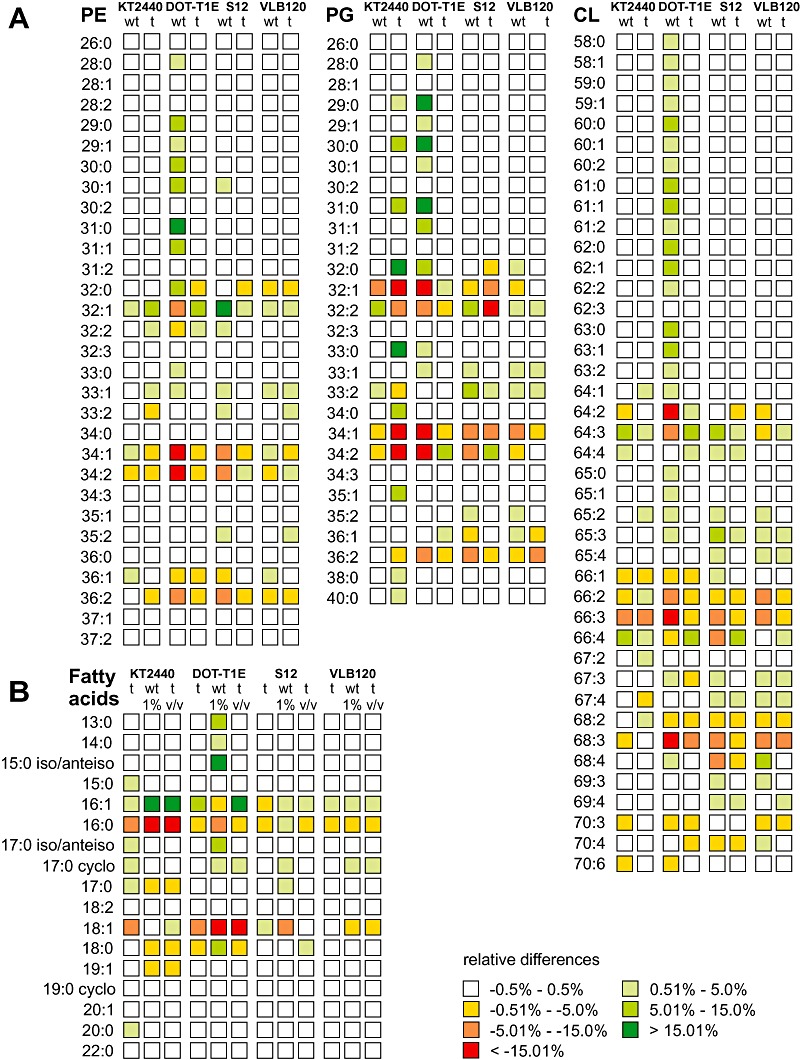
Figure 4.

Relative differences of the glycerophospholipid species and fatty acid moieties of P. putida following n‐butanol exposure. A. Relative differences in the relative amounts of glycerophospholipid species were calculated compared with the average of non‐treated and treated cells grown at reference conditions. B. Relative differences of the relative amounts of fatty acid moieties compared with the average abundance of fatty acids of non‐treated cells grown at reference conditions. Abbreviations: wt, non‐treated; t, treated cells.
