
Figure 4.
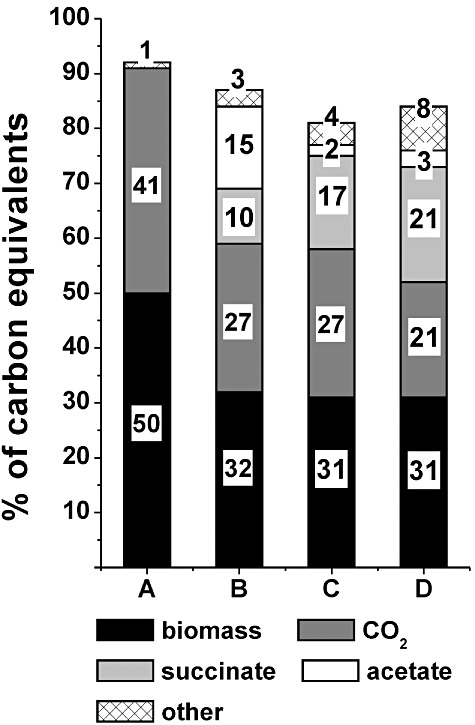
Comparison of the carbon balances of C. glutamicum aerobic succinate producer strains calculated as percentage of product (mmol carbon) of the consumed glucose (mmol carbon) at the end of glucose consumption phase presented as mean values from the performed experiments. For cultivation conditions see legend of Fig. 3. (A) Corynebacterium glutamicum wild type after 12 h; (B) C. glutamicumΔsdh after 14 h; (C) C. glutamicum BL‐1 after 14 h; (D) C. glutamicum BL‐1 with pAN6‐pycP458Sppc after 14 h.