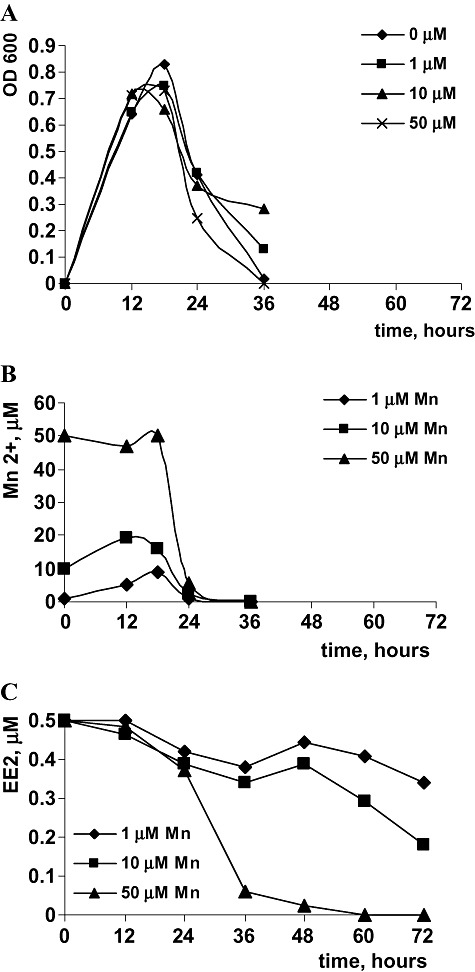
Figure 1.

A. Growth of P. putida in the presence of 0.5 µM of EE2 and 1, 10 and 50 µM of Mn2+. B. Dynamics of Mn2+ oxidation. C. Dynamics of degradation of 0.5 µM of EE2 with different initial concentrations of Mn2+. For each measurement, data represent a mean value obtained from three identical cultures.
