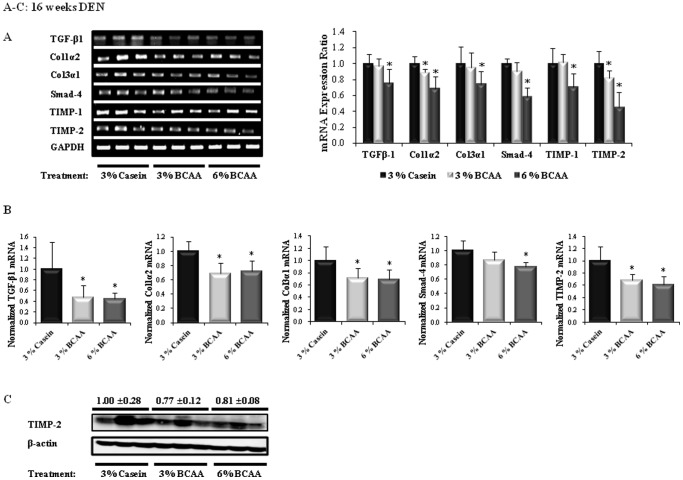
Figure 3. Effects of BCAA supplementation on liver fibrosis in rats after 16 weeks of DEN administration.
The relative band intensities of the fibrosis markers are shown in the right-hand panels (A). The expression levels of mRNA for TGF-β1, Col1α2, Col3α1, Smad-4, and TIMP-2 were determined by quantitative Real-Time reverse-transcription polymerase chain reaction (RT-PCR) (B). TIMP-2 protein expression was determined by Western blotting (C). The level of expression of each gene is normalized to those of GAPDH (A and B) and β-actin (C). The lanes contain the mRNA (A) and protein (C) samples from three rats per group. Values shown are means ± standard deviation. *P<0.05.

