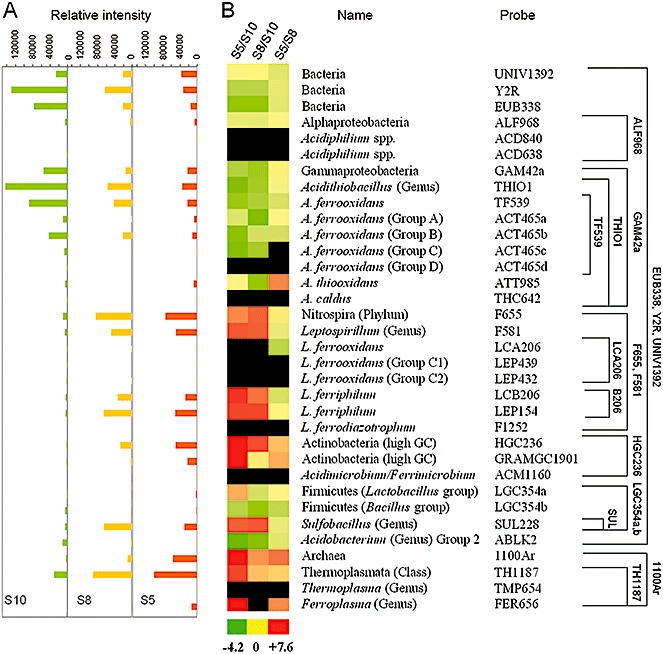
Figure 4.

A barcode for industrial biolixiviation process by assaying total industrial heap RNA with a prokaryotic acidophile microarray (PAM). A. Histograms showing the average relative signal intensity of two different hybridizations for the different analysed strips, from younger to older ones (S10‐S8‐S5). Each bar of the histogram aligns horizontally with the corresponding strain name or phylogenetic group and probe (in B). B. Relative proportion of the different metabolically active phylogenetic groups by using prokaryotic acidophile microarray (PAM). The PAM results were obtained after two‐colour simultaneous hybridization with total fluorescent labelled environmental RNA from three samples of the industrial heap of August 2007 (S5, Cy5 labelled; S8, Cy5 and Cy3 labelled; S10, Cy3 labelled). After two‐colour simultaneous hybridizations (S5/S10, S8/S10 and S5/S8), the Log2 ratio between the signal intensity from each sample was calculated and clustered for comparison along sampling times (coloured figure). The log2 ratio values ranged from −4.2 (the most green), through 0 (yellow), to +7.6 (the most red). Black colour indicates no signal detected with the corresponding probe. Representative phyla and species are indicated, as well as a phylogenetic tree showing the probe range (right scheme).
