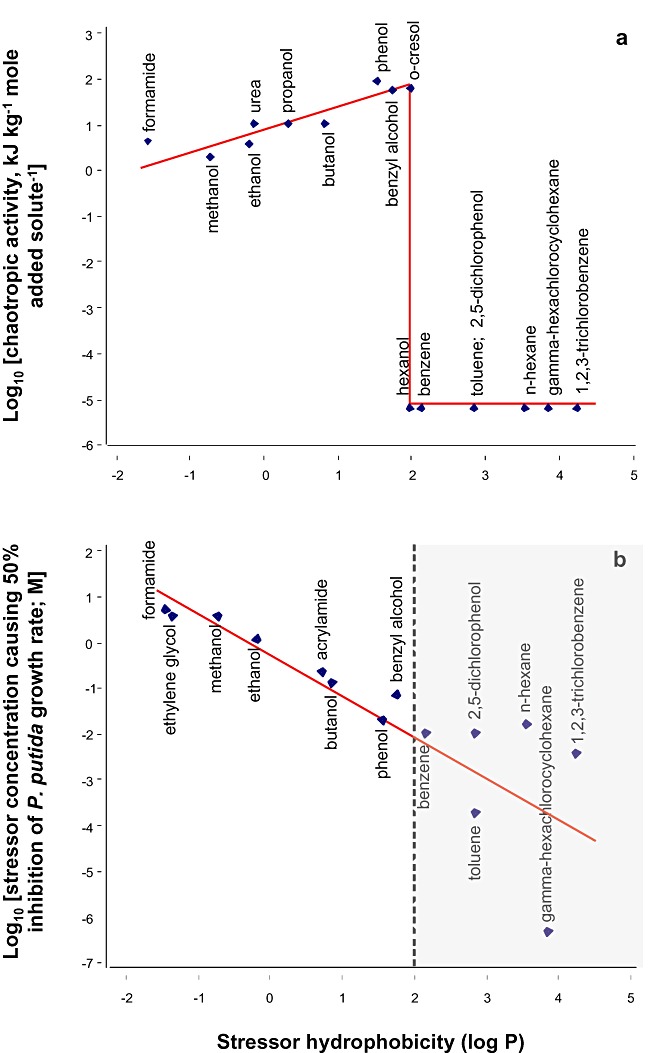
Figure 1.

Activities of hydrophobic substances, and other environmentally relevant stressors, in macromolecular (A) and cellular systems (B) versus log Poctanol–water for (A) chaotropic solute activity – quantified using agar gelation as a model system – and (B) inhibitory activity against P. putida. Trend lines are shown in red, and the grey shaded area in (B) indicates the log P region for hydrophobic stressors. The values for chaotropic activity that were calculated from agar : stressor solutions are listed in Table S1; chaotropicity (±1.2 kJ kg−1; see Table S1) and growth‐rate values are means of three independent experiments, and these values were plotted on logarithmic scales.
