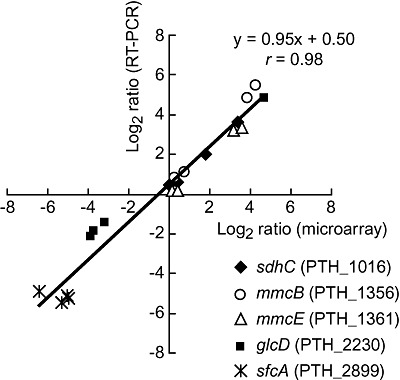
Figure 2.

Comparison of qRT‐PCR and microarray data. Filled diamond, succinate dehydrogenase cytochrome b subunit (sdhC, PTH_1016); open circle, fumarase N‐terminal domain (mmcB, PTH_1356); open triangle, methylmalonyl‐CoA mutase N‐terminal domain (mmcE, PTH_1361); filled square, predicted lactate dehydrogenase (glcD, PTH_2230); asterisk, malic enzyme (sfcA, PTH_2899). The approximation curve and correlation coefficient (r) are given.
