
Figure 4.
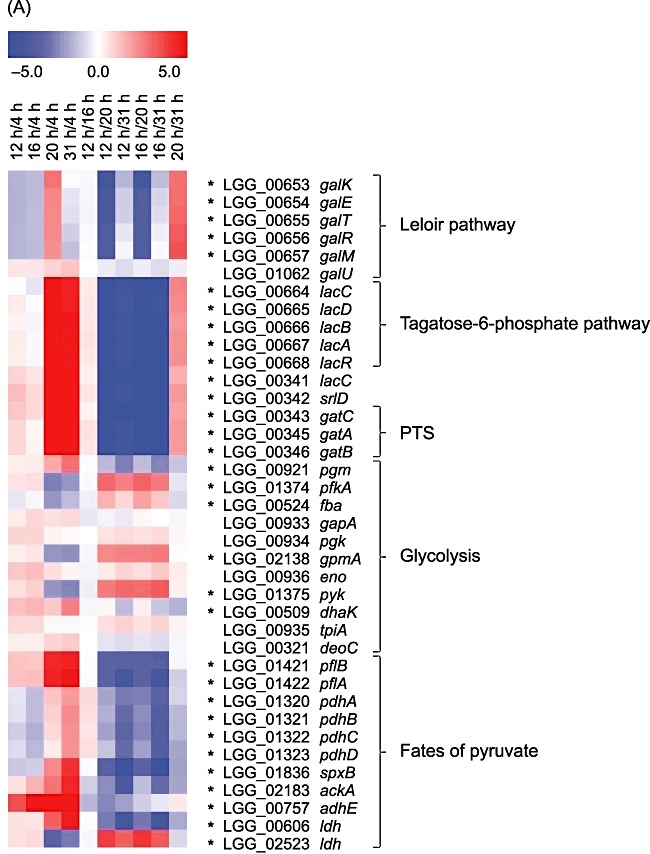
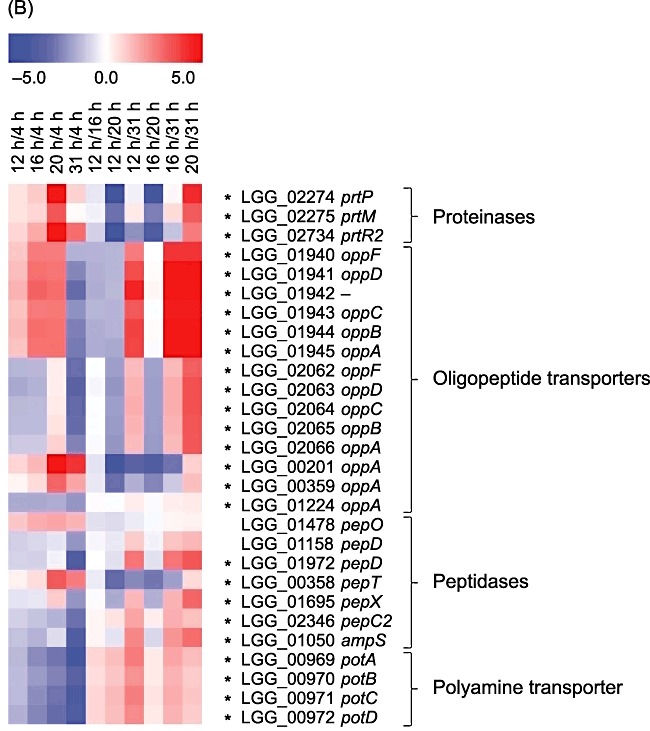
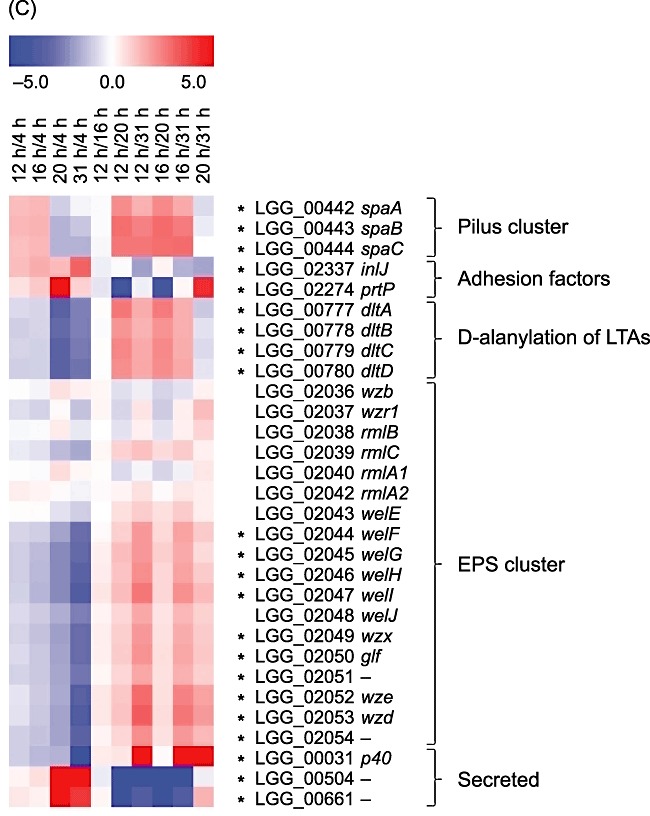
Gene expression patterns of selected genes and operons during growth in whey coding for (A) carbohydrate and pyruvate metabolic proteins, (B) proteinases, peptidases and amino acid transporters and (C) probiotic‐associated factors. Gene expression changes (averages of three biological replicates) between paired time points are represented colorimetrically, with dark red indicating an expression ratio of 5.0 and dark blue indicating an expression ratio of −5.0 on a log2 scale. The first four lanes show results of comparison of time points 12, 16, 20 and 31 h to the time point 4 h corresponding to the mid‐exponential phase. Statistically significant changes (P‐value ≤ 0.01) are marked with asterisks.