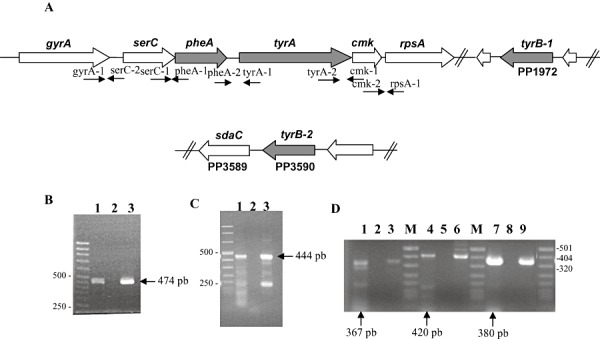
Figure 4.

A. Gene organization of the clusters encoding enzymes for the phenylalanine and tyrosine biosynthesis pathway in P. putida KT2440. Genes involved in phenylalanine and tyrosine biosynthesis are in grey. B–D. Transcriptional Organization of the genes involved in phenylalanine and tyrosine biosynthesis. (B) Electrophoresis of cDNA amplified with primers serC‐1/pheA‐1 (lane 1 expected size 474 bp). Lane 2 corresponds to the negative control and lane 3 corresponds to the positive control. (C) Electrophoresis of cDNA amplified with primer pheA‐2/tyrA‐1 (lane 1 expected size 444 bp). Lane 2 corresponds to the negative control and lane 3 corresponds to the positive control. (D) Electrophoresis of cDNA amplified with primers gyrA‐1/serC‐2 (lane 1 expected size 367 bp), tyrA‐2/cmk‐1 (lane 4 expected size 420 bp) and cmk‐2/rpsA‐1 (lane 7 expected size 380 bp). Lanes 2, 5, 8 correspond to the negative controls without reverse transcriptase and lanes 3, 6, 9 correspond to the positive controls. M refers to molecular weight markers.
