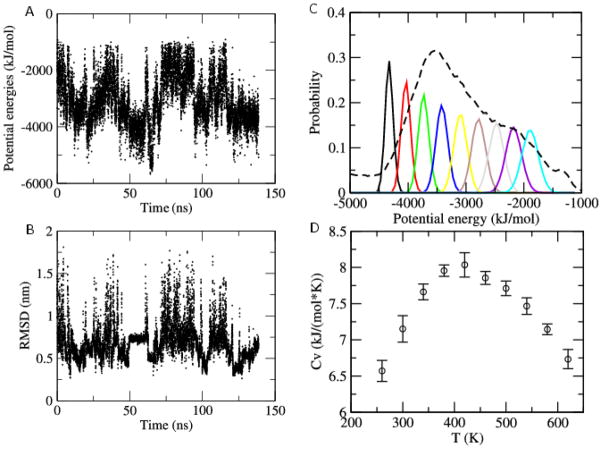
Figure 6.
Potential energy (A) and root-mean-square deviation (RMSD) to the native structure (B) as function of time for a randomly selected trajectory. Distribution of potential energy without re-weighting (dashed line) and after re-weighting to nine different temperatures between 280 K and 600 K (solid lines) (C). Specific heat capacity as a function of temperature (D).

