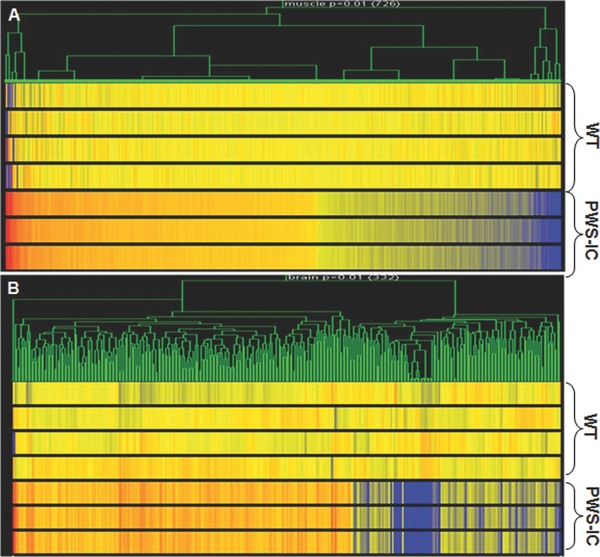
Figure 1.

Genome microarray analysis of gene expression heat map in the skeletal muscle and brain samples of PWS‐IC del mice. (A) Gene‐based clustering for the genes in the skeletal muscle (726 genes) and (B) in the brain (332 genes) of the PWS‐IC del mice from the Ingenuity's top network 1 (p < 0.01), analyzed together with 6 MD groups in Plier (normalization: per gene – to controls; per chip – to 50th percentile) compared to control littermates. Red color = up‐regulated genes; blue color = down‐regulated genes.
