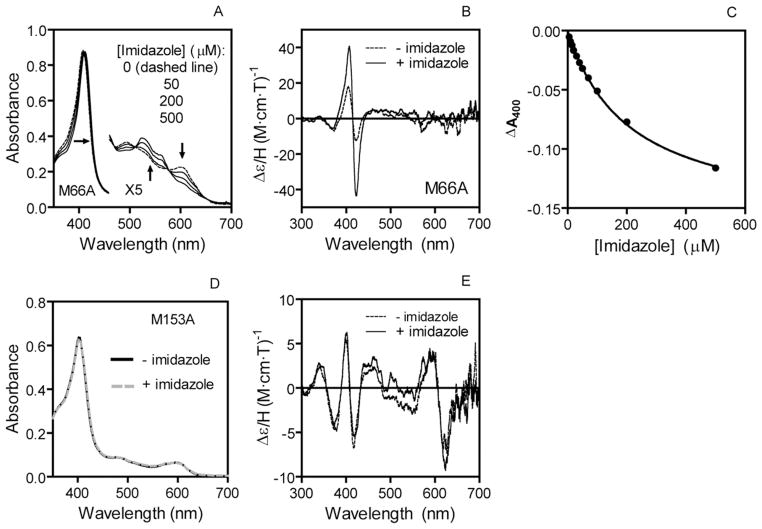
FIGURE 4.
Effects of imidazole on optical (A and D) and MCD (B and E) spectra of ShpM66A and ShpM153. The optical and MCD spectra of each Shp protein in 20 mM Tris-HCl (for optical spectra) or 50 mM potassium phosphate (for MCD), pH 8.0, at the indicated imidazole concentrations. The arrows in panel A indicate the directions of the spectral shifts as imidazole concentrations are shown. C, imidazole titration of ΔA400 of ShpM66A.

