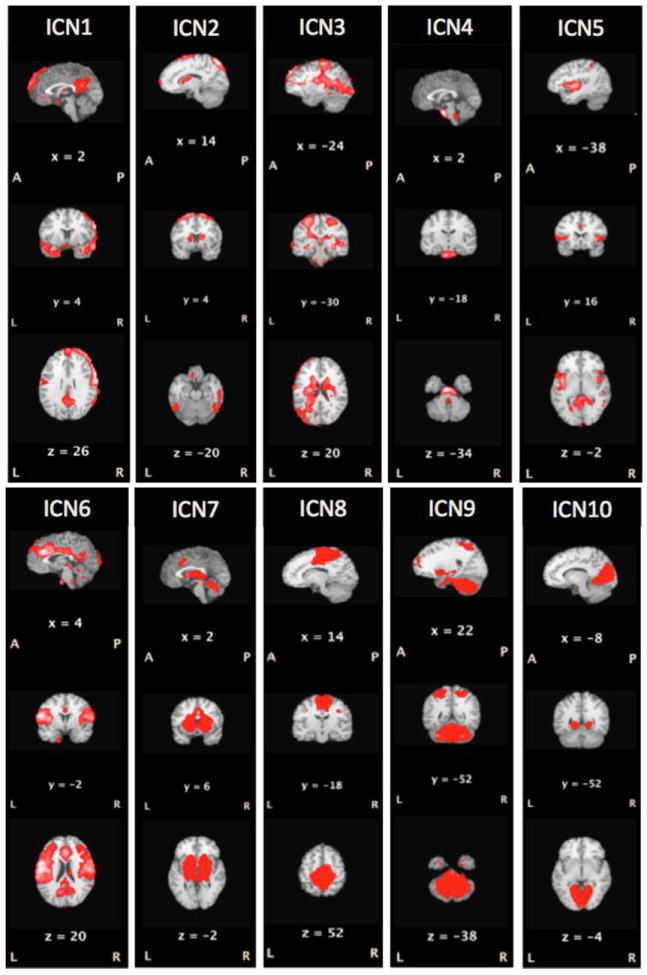
Figure 2. Intrinsic Connectivity Networks (ICNs).

The ten ICNs accounting for the greatest variance in seven, soundly sleeping (NREM3), preschool-aged children (24-58 months) are illustrated (p≤ 0.05). The ICNs observed here in sleeping children corresponded closely both to those reported in 35 awake, resting-state in health adults and to those observed by applying ICA analysis the BrainMap database (Fox and Lancaster, 2002), a large (~ 33,000 subjects) task-state data set (Smith, Fox et al., 2009). Table 2 lists the observed pediatric ICNs ranked by variance accounted for and the closest analog (by spatial pattern) from adult networks.
