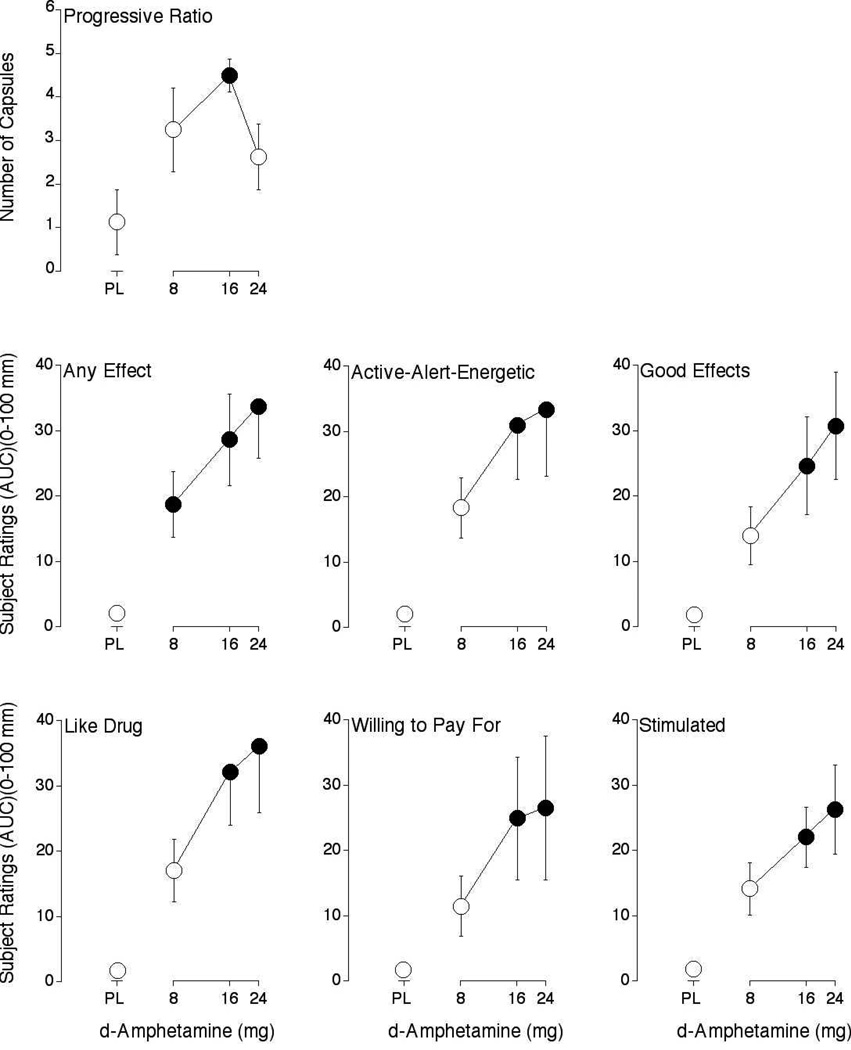
Figure 1.
Dose-response functions for number of capsules earned on the progressive-ratio procedure, along with subjective ratings of Any Effect, Active-Alert-Energetic, Good Effects, Like Drug, Willing to Pay For and Stimulated from the Drug-Effect Questionnaire. Data are expresses as area-under-the-time-action curve (AUC). Horizontal axes: d-amphetamine dose in mg; data points above PL designate placebo values. Data points show means of 8 subjects; brackets show ± 1 S.E.M. Unidirectional brackets used in some instances for clarity. Filled symbols indicate those values that are significantly different from the placebo data point (p < 0.05, Fisher’s Protected Least Significant Difference post hoc test)

