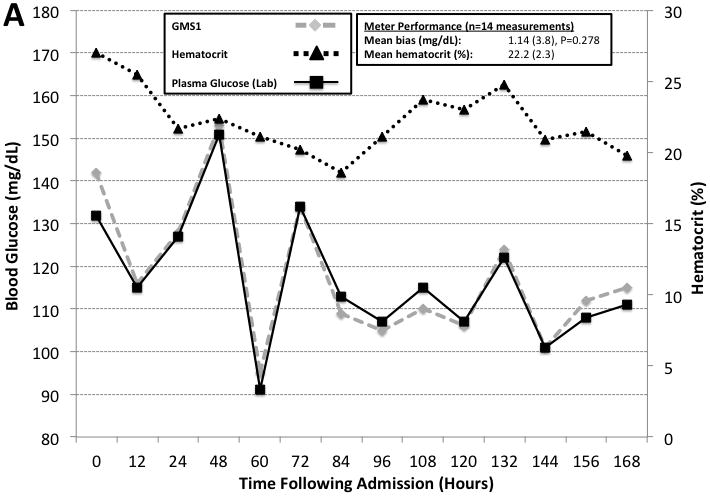
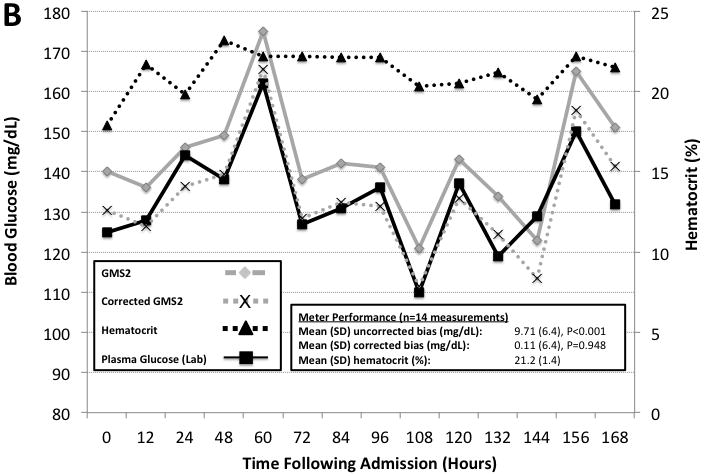
Figure 4. Hematocrit Correction During Intensive Insulin Therapy.


Two case examples illustrating hematocrit effects on GMS1 vs. GMS2 when compared to paired hospital plasma glucose measurements. Paired hematocrit measurements are also reported. All measurements were made every 12 hours. Panel A is a case involving a 37 year old man with 37% TBSA burns assigned to the GMS1 group. Panel B is a case involving a 38 year old woman with 45.5% TBSA burns assigned to the GMS2 group. GMS2 measurements exhibited significant bias. GMS2 bias was mitigated by applying the correction factor derived from the prospective observational study and representative of the patient’s mean hematocrit (−9.6 mg/dL for anemic samples).
