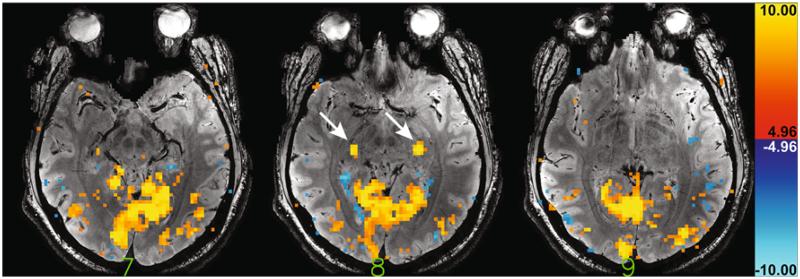
Fig. 2.
Example activation map for the 5-min block paradigm for three slices of one of the volunteers. Arrows highlight the distinct bilateral LGN activation in the central of these three slices. A significance threshold of t = 4.96 (p < 0.05, corrected for multiple comparisons) was used for the activation overlay. The first echo of the high resolution anatomical data (with 15 ms echo time) for those same three slices, which were used for LGN identification, was used as the underlay

