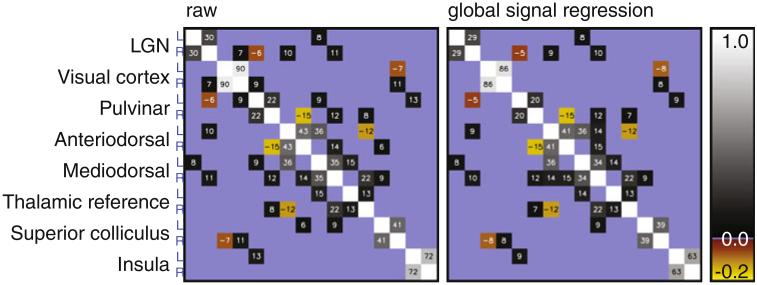
Fig. 4.
Partial correlation matrices for the regions investigated here. ROI-averaged signal from each hemisphere was analyzed separately. The analysis was performed on ROI-averaged time course signals from data not subject to (left) and subject to (right) global signal regression. Partial correlation was not significant (determined using the variance over volunteers) in areas shaded in blue. Values in the other, significantly non-zero, areas are the partial correlation value for that pair or regions multiplied by 100

