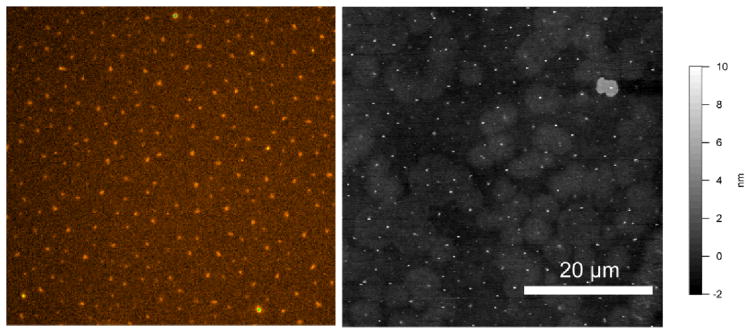
Figure 3.

Distribution of the single ssDNA oligomers(150 bases) immobilized on Au surfaces is visualized using fluorescent (A) and tapping mode AFM (B) imaging after hybridization with a Cy5-labeled primer (21 bases, complementary to the end opposite to immobilization site). The density of ssDNA is comparable in both images.
