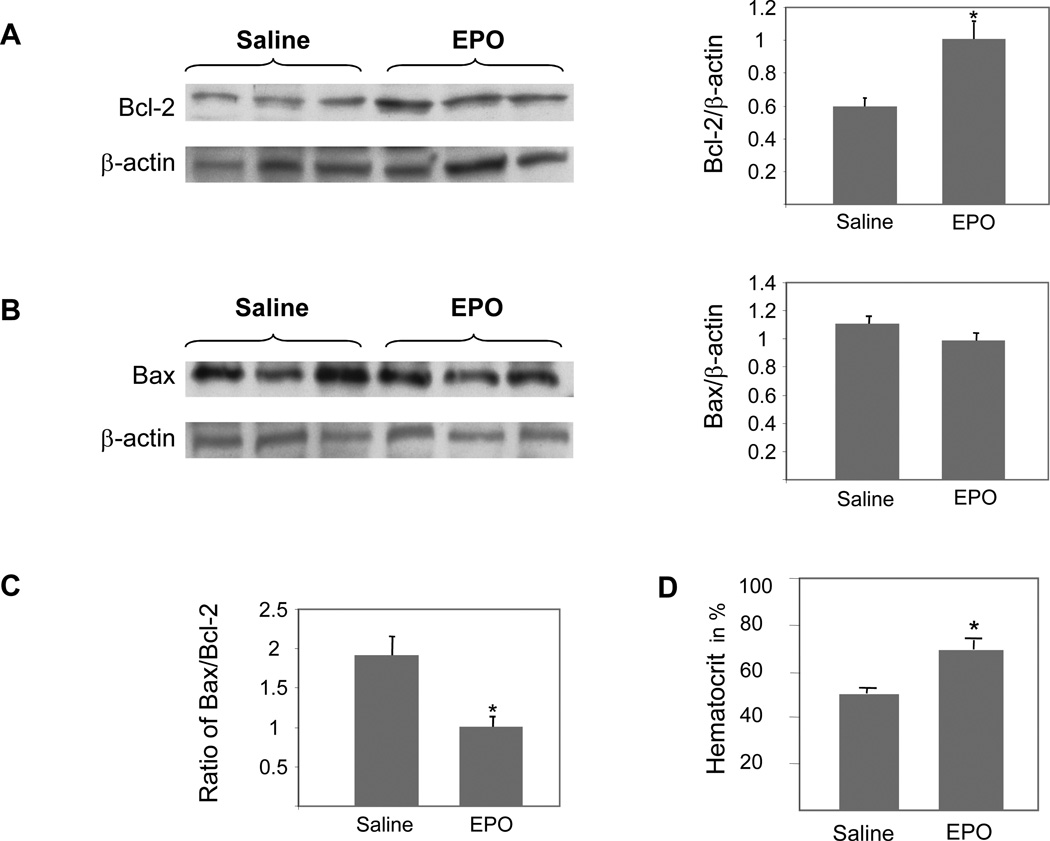
Figure 2.
(A): Upregulation of Bcl-2 protein expression by EPO as assessed by Western blotting. HUVECs were treated as described in “METHODS” and as specified in table 1. HUVEC extracts were subjected to Western blotting using a mouse monoclonal antibody to quantitate Bcl-2 protein expression. All lanes in the gel were loaded with equal amounts of total protein and integrated densities (mean ± s.e.) of the Bcl-2 protein bands obtained from scannings of autoradiographs from two independent experiments are displayed in the histogram. The blot was stripped and reprobed with an antibody directed against ß-actin (B) Downregulation of Bax protein expression by EPO as assessed by Western blotting. HUVEC extracts used for experiments in figure 2A were subjected to Western blotting using a mouse monoclonal antibody to quantitate Bax protein expression. All lanes in the gel were loaded with equal amounts of total protein and integrated densities (mean ± s.e.) of the Bax protein bands obtained from scannings of autoradiographs from two independent experiments are displayed in the table. The blot was stripped and reprobed with an antibody directed against ß-actin (C) Effect of EPO treatment on Bax/Bcl-2 ratio in LPS-stimulated HUVECs. Integrated densities of Bax protein bands were divided by corresponding densities for Bcl-2 protein bands. Data shown is representative of three independent experiments. (D) Effect of EPO treatment on Bax/Bcl-2 ratio in hydrogen peroxide-stimulated HUVECs. Integrated densities of Bax protein bands were divided by corresponding densities for Bcl-2 protein bands. Data shown is representative of three independent experiments.

