Figure 3.
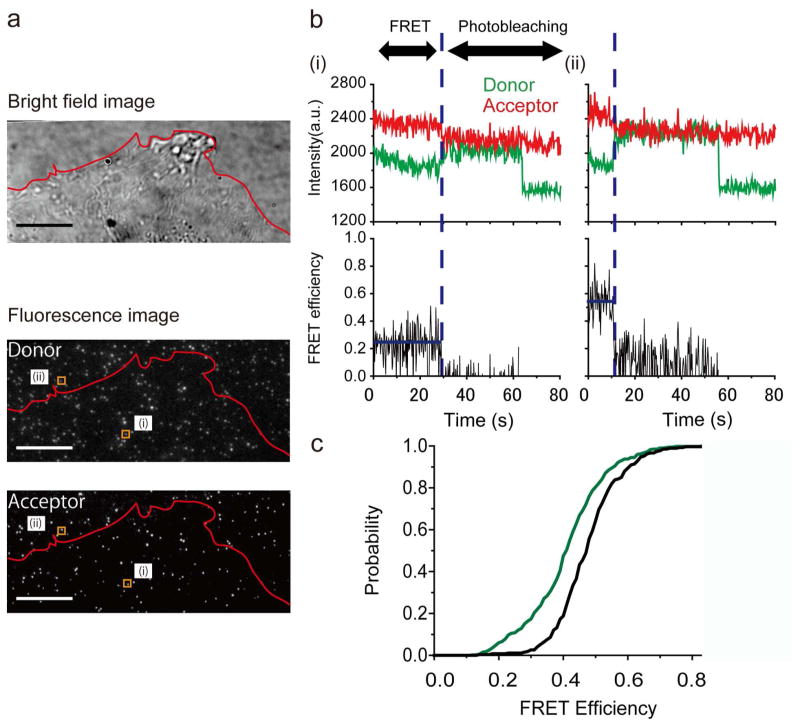
Force exerted by single integrins. (a) HFFs spreading on a MTS-coated coverslip visualized in brightfield; individual molecules are clearly visible in the donor and acceptor channels. Scale bar: 10 μm. The outlined regions (i) and (ii) correspond to molecules exhibiting high and low FRET, and residing outside the cell boundary and underneath the cell, respectively. (b) Raw single-molecule FRET traces from molecules (i) and (ii). Two-step photobleaching indicates the presence of a doubly-labeled sensor. (c) Cumulative probability distributions of FRET values measured for individual MTS molecules in the presence (green; 398 molecules, 13 cells) and absence of cells (black; 266 molecules). The distributions are statistically distinct (2 sample Kolmogorov-Smirnov test, p-value: 1.7×10⁻¹²).

